Algorand’s Comeback Trail: Can ALGO Defy the Odds by 2031?

Silicon Valley’s favorite ’Ethereum killer’ has been bleeding market share—but whispers of a resurgence are getting louder. Here’s why traders won’t write off Algorand just yet.
The 2025 inflection point
With institutional adoption of pure-proof-of-stake chains accelerating, ALGO’s carbon-neutral tech stack suddenly looks less like academic over-engineering and more like regulatory future-proofing. Especially when SEC subpoenas start flying at less compliant L1s.
2031 moonshot or ghost chain?
Either Algorand’s institutional-grade DeFi tools attract real-world asset tokenization deals, or it becomes another cautionary tale about perfect tech meeting imperfect markets. Wall Street doesn’t care about Byzantine fault tolerance—until it does.
Bonus cynicism: If ALGO pumps, rest assured some VC who forgot they still held bags will immediately dump on retail.
Overview
| Symbol | ALGO |
| Current Algorand price | $0.2507 |
| Market cap | $2.15B |
| Trading volume | $140.94M |
| Circulating supply | 8.59B |
| All-time high | $3.28 on Jun 21, 2019 |
| All-time low | $0.08761 on Sep 11, 2023 |
| 24-hour high | $0.2584 |
| 24-hour low | $0.2360 |
Algorand price prediction: Technical analysis
| Metric | Value |
| Volatility (30-day variation) | 8.72% |
| 50-day SMA | $0.2023 |
| 200-day SMA | $0.2345 |
| Current Algorand sentiment | Bullish |
| Green days | 17/30 (57%) |
Algorand price analysis
On May 12, ALGO’s price ROSE by 30.28% in the last 30 days and 6.91% in the last 24 hours. Its trading volume rose by 11.64% in 24 hours, signaling rising interest from traders. Algorand’s total value locked (TVL), the number of funds locked up in its ecosystem’s decentralized applications, recovered to $49.99M.
Algorand 1-day chart analysis
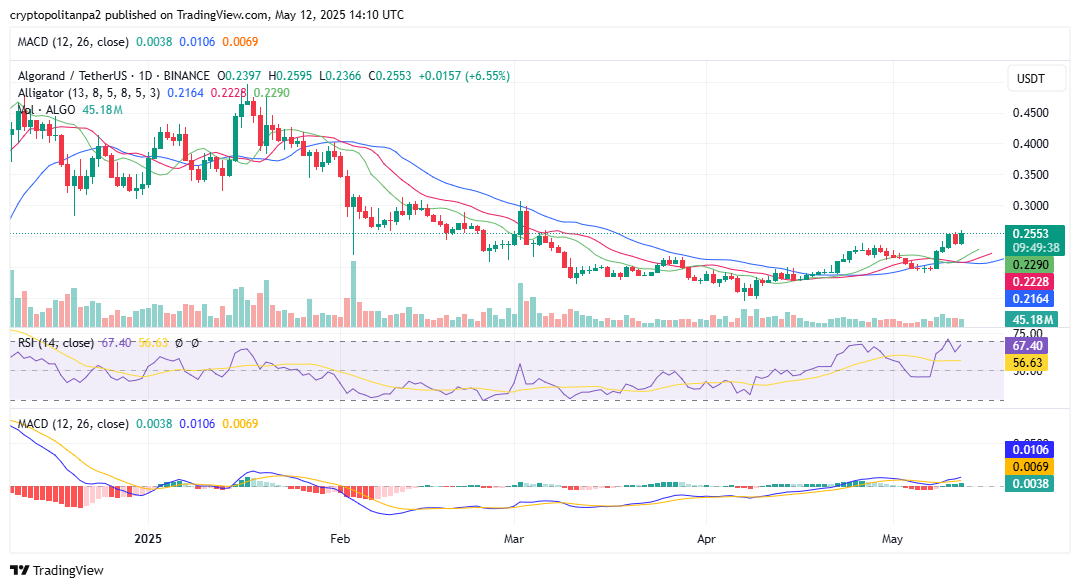
ALGO’s price movement shows that it is now recovering. The William Alligator is feeding, meaning rising volatility. The relative strength index is 67.40 in neutral territory, while the MACD histogram shows that its positive momentum rose over the last three days. A coin is considered overbought when its RSI rises above 70.
Algorand 4-hour chart
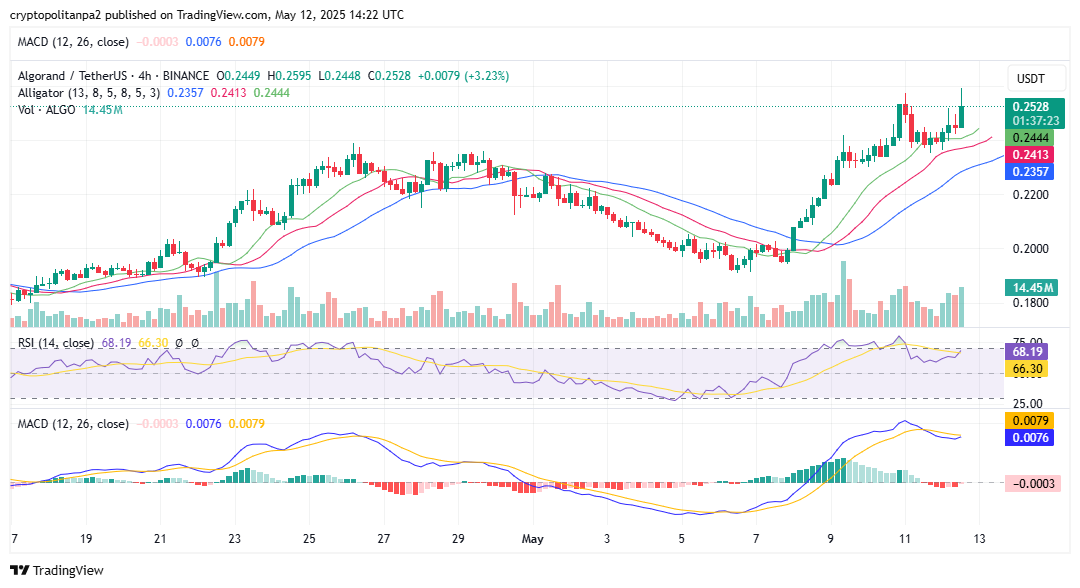
The 4-hour chart shows that ALGO is rising from the month’s low at $0.1909, and it registers negative momentum. The coin’s volatility is rising in this timeframe.
Algorand technical indicators: Levels and action
Daily simple moving average (SMA)
| Period | Value ($) | Action |
| SMA 3 | 0.2179 | BUY |
| SMA 5 | 0.2258 | BUY |
| SMA 10 | 0.2128 | BUY |
| SMA 21 | 0.2184 | BUY |
| SMA 50 | 0.2023 | BUY |
| SMA 100 | 0.2253 | BUY |
| SMA 200 | 0.2345 | BUY |
Daily exponential moving average (EMA)
| Period | Value ($) | Action |
| EMA 3 | 0.2082 | BUY |
| EMA 5 | 0.1999 | BUY |
| EMA 10 | 0.1923 | BUY |
| EMA 21 | 0.1927 | BUY |
| EMA 50 | 0.2159 | BUY |
| EMA 100 | 0.2452 | BUY |
| EMA 200 | 0.2477 | BUY |
What to expect from Algorand price analysis next?
Per our technical indicators, ALGO is bulish, with the fear and greed index showing a greed sentiment among investors. Data analysis shows that activity on decentralized finance applications is recovering, with the charts showing that it could rise further in coming days.
Why is ALGO down?
ALGO is dropping from previous highs set in the last quarter of 2024, The drop could be attributed to the crypto market’s correction, which saw Bitcoin drop below $99,000.
Will ALGO reach $1?
Per our Cryptopolitan price prediction, ALGO will break above $1 in the period ending in 2028.
Can Algorand reach $10?
Per our Cryptopolitan price prediction, it remains highly unlikely for ALGO to break above $10 in the period ending in 2031.
Can Algorand reach $20?
Per our Cryptopolitan price prediction, it remains highly unlikely for ALGO to break above $20 in the period ending in 2031.
Can ALGO reach $100 dollars?
At $100, Algorand’s market capitalization has to rise above $700 billion from the current $1.2 billion. In comparison, Ethereum’s market capitalization is at $400 billion. Per our price prediction, Algorand is highly unlikely to reach $100.
Is there a future for Algorand?
Like most mega-altcoins, Algorand is trading at its lowest level this year. A break below 30 RSI will be crucial to sending it to previous highs. Looking ahead, ALGO will register new all-time highs in the coming years.
What will Algorand be worth in 2025?
For the last month of 2025, ALGO’s price will range between $0.2960 and $0.4313. The average price for the period will be $0.3900.
Is ALGO a good investment?
Analysis by Intotheblock shows that 97% of holders are at a loss at the current price. The figure will likely drop lower in the short term. However, as our Cryptopolitan price prediction shows, this will change over the long term.
Recent news
According to DeFiLlama, the total value locked in the network has crashed to $42 million, its lowest level since July 2023. The figure has dropped sharply from the year-to-date high of $187 million. Most dApps in Algorand have shed millions in asset value.
ALGO price prediction May 2025
The Algorand network price forecast for May is a maximum price of $0.1950 and a minimum price of $0.1660. The average price for the month will be $0.1870.
| Month | Potential low ($) | Potential average ($) | Potential high ($) |
| May | 0.1660 | 0.1870 | 0.1950 |
Algorand price prediction 2025
For the last month of 2025, ALGO’s price will range between $0.1660 and $0.4313. The average price for the period will be $0.3900.
| Year | Potential low ($) | Potential average ($) | Potential high ($) |
| 2025 | 0.1660 | $0.3900 | 0.4313 |
Algorand price prediction 2026 – 2031
| Year | Potential low ($) | Potential average ($) | Potential high ($) |
| 2026 | 0.5404 | 0.5558 | 0.6531 |
| 2027 | 0.7777 | 0.7999 | 0.9598 |
| 2028 | 1.1400 | 1.1700 | 1.3500 |
| 2029 | 1.6100 | 1.6600 | 1.96 |
| 2030 | 2.21 | 2.29 | 2.73 |
| 2031 | 4.49 | 4.66 | 5.48 |
Algorand price prediction 2026
The year 2026 will experience more bullish momentum. Our Algorand price prediction estimates it will range between $0.5404 and $0.6531, with an average price of $0.5558.
Algorand price prediction 2027
Algorand prediction climbs even higher into 2027. According to the prediction, ALGO’s price will range between $0.7777 and $0.9598, with an average price of $0.7999.
Algorand price prediction 2028
Our analysis indicates a further acceleration in ALGO’s price. It will trade between $1.14 and $1.35, with an average trading price of $1.17.
Algorand price prediction 2029
According to the ALGO price prediction for 2029, the price of ALGO will range from $1.61 to $1.96, with an average price of $1.66.
ALGO price prediction 2030
The ALGO price prediction for 2030 indicates the price will range between $2.21 and $2.73. The average price of ALGO will be $2.29.
Algorand ALGO price prediction 2031
The ALGO price forecast for 2031 is a high of $5.48. It will reach a minimum price of $4.49 and average at $4.66.

Algorand market price prediction: Analysts’ ALGO price forecast
| Platform | 2025 | 2026 | 2027 |
| Digitalcoinprice | $0.36 | $0.45 | $0.62 |
| Coincodex | $0.19 | $0.15 | $0.14 |
| Gate.io | $0.36 | $0.45 | $0.62 |
Cryptopolitan’s Algorand price prediction
Our predictions show that ALGO will achieve a high of $0.4313 in 2025. In 2027, it will range between $0.7770 and $0.7999, with an average of $0.9598. In 2030, it will range between $2.21 and $2.73, with an average price of $2.29. Note that the predictions are not investment advice. Seek independent professional consultation or do your research.
Algorand historic price sentiment

- Algorand held its token sale in June 2019 at $2.40 each.
- Union Square Ventures, Lemniscap, and NGC Ventures, among others, held earlier funding rounds. The public sale raised $60.40 million while funding rounds raised $66 million.
- Token sale participants who held their tokens since launch are down 90%.
- Binance listed ALGO on 21 June 2019. According to CoinMarketCap data, it pumped after the listing to reach its all-time high (ATH) at $3.28.
- ALGO later crashed; four months later, it was down 90% from its ATH.
- In July 2021, Coinbase listed ALGO. As a result, it gradually recovered and peaked at $0.64 in August.
- In retrospect, 2021 was the golden year for the crypto market. The emergence of NFTs, DeFi growth, and institutional interest drove growth.
- So, in 2021, it rose from a low of $0.32 in January to $2.30 in October, a 200% gain.
- Nothing prepared crypto enthusiasts for the 2023 crypto winter, which worsened with the FTX crash. The year closed with ALGO trading at $0.23.
- The decline continued through 2023, registering an all-time low at $0.0876 in September.
- The market’s recovery began in October. By the end of the year, it had risen above $0.2.
- It began recovering in November from a low of $0.12, rising as high as $0.61 in December.
- It then corrected into 2025 below the $0.40 mark in January, $0.35 in February, $0.21 in March, and $0.20 in May.
