Bitcoin Tightens Grip in Q1 2025 While Crypto Markets Bleed Out

Market cap tanks, traders flee—but BTC’s dominance hits new highs. The ’digital gold’ narrative flexes as altcoins get crushed under bearish pressure.
Meanwhile, Wall Street’s latest ’blockchain innovation’ ETF quietly folds after 11 weeks. Some things never change.
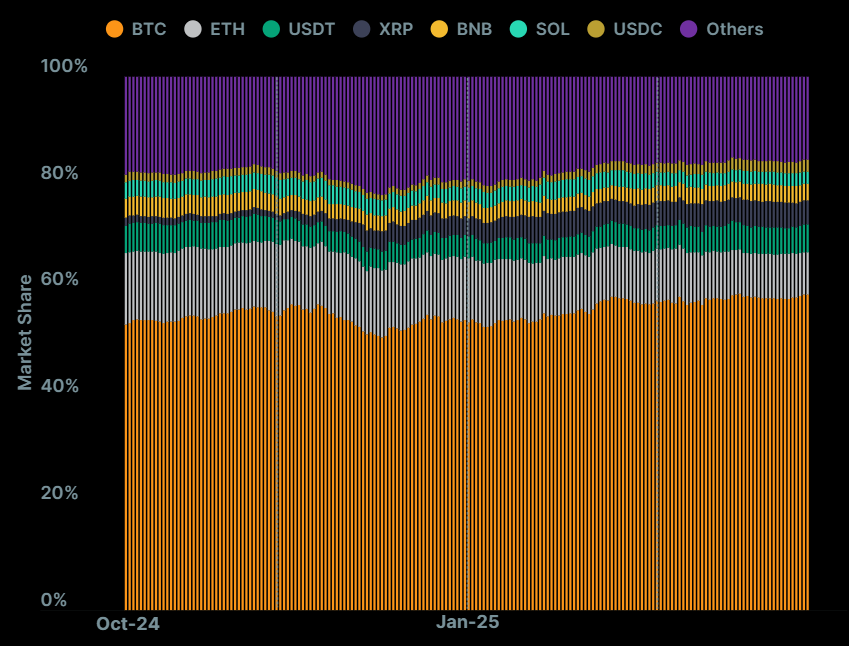 Crypto dominance. Source: CoinGecko
Furthermore, stablecoins “benefited from the market downturn,” as well. This is because investors turned to this asset type seeking stability.
However,dropped by 3.9 percentage points, with its dominance at 7.9%. This is the lowest it has been since late 2019, the report noted.
Onlyandamong the ‘major’ coins preserved their market share.
You might also like Q1 Trading Volume Plunges 41%, Sentiment Hits 2-Year LowMarket Sees Plunging Prices, Trading Volumes, TVLs
In January 2025, BTC reached its new all-time high of $106,182. However, by the end of Q1, it fell 11.8% to $82,514.
At the same time, ETH ended the quarter with a whopping 45.3% decrease to $1,805. “It has erased its gains from 2024, returning to levels last seen in 2023,” the report said. The coin “severely underperformed majors such as,,, and, all of which declined to a much lesser degree.”
Furthermore, trading volume fell from a daily average of $30 billion in Q4 2024 to $24.4 billion in Q1 2025. The report noted that the days in which volume spiked saw the price of ETH plummet.

Meanwhile, multichain DeFi Total Value Locked (TVL) dropped 27.5% from $177.4 billion at the end of 2024 to $128.6 billion at the end of March 2025. “This was largely due to the significant depreciation in value of altcoins,” CoinGecko said.
Among the chains, Ethereum lost “a significant portion” of its TVL: 35.4% from $112.6 billion to $72.7 billion.
Furthermore,andrecorded notable decreases of 23.5% and 15.3%, respectively.
You might also like April 2025 Altcoin Outlook: Expert Analysis, Predictions, and Top Trends to WatchCEX and DEX
The report found that in the first quarter of this year, the top 10 centralized exchanges (CEXs) recorded $5.4 trillion in spot trading volume. This is a 16.3% decrease quarter-on-quarter.
was still the dominant spot CEX, with a 40.7% share at the end of the quarter. While its market share increased over the quarter, its trading volume fell to $588.7 billion in March. In comparison, it surpassed the $1 trillion mark in December.
However, in the top 10,was the only exchange to grow in Q1 (11.4%), while the rest dropped between 1.8% and 34%. The latter wasdecrease, falling to $371 billion.
Month-on-month, unsurprisingly, Bybit fell the most: 52.4% from $178.2 billion to $84.7 billion.
Meanwhile, when it comes to decentralized exchange (DEX) trading, Solana dominated the space. It saw a 35.3% rise from $217 billion in Q4 to $293.7 billion in Q1, with a market share of 39.6% in the first quarter.
Notably, in January, Solana accounted for 52% of on-chain trades amongst the top 12 blockchains. This was “driven by the ‘political memecoin’ frenzy” led by the TRUMP coin.
Solana recorded an all-time high of over $184.8 billion in trading volume, reducing Ethereum’s market share to below 20% for the first time.
That said, Ethereum reclaimed the top spot in March, the report said, with a 30.1% market share compared to Solana’s 23.4%.
Finally,andfell out of the top 10 in March as newcomersandmoved in. “However, over the entire quarter, both chains stayed ahead,” the report concluded.
You might also like Binance Reveals Reward-Bearing Token LDUSDT