DogWifHat ($WIF) Surges 25% Amid Meme Coin Market Rally—Because Apparently, This Is What ’Financial Progress’ Looks Like Now

The meme coin circus is back in town—$WIF leads the charge with a 25% pump as the sector’s market cap balloons to $53.95B. Traders pile in, fundamentals check out (just kidding, there are none), and the crypto casino spins another round. Will it last? Of course not. But hey, those leveraged longs won’t YOLO themselves.
$WIF Plummeted Post-Coinbase High But Is Now Climbing Back
Launched in November 2023, DogWifHat ($WIF) built its identity around meme culture, featuring a Shiba Inu wearing a pink knitted hat.
It held the position of the third-largest meme coin by market cap, behind Dogecoin and Shiba Inu, for much of 2024.
Despite its meteoric rise, $WIF has since fallen 88.49% from its all-time high of $4.85, reached shortly after a Coinbase listing in December. It now ranks eighth among meme coins by market cap.
 JUST IN: $WIF (@dogwifcoin) jumps over 9% on @coinbase International Exchange Listing announcement. pic.twitter.com/zdW5P22E9E
This decline was part of a broader sector-wide crash in early February 2025, which saw tokens like $PEPE, $BONK, $SHIB, and even $FARTCOIN lose over 40% of their value.
Analysts attributed the downturn to post-hype fatigue, profit-taking, and broader market liquidation, including the fallout from the Trump meme coin crash in January, which drained billions in liquidity.
$WIF Influencers Under Fire Despite Volume and Open Interest Spike
DogWifHat ($WIF) also faced criticism after prominent X (formerly Twitter) influencer Ansem, a well-known Solana and $WIF bull, predicted a $10 price target by Christmas 2024, even suggesting a speculative peak of $100.
buying $WIF $2.75-$3.0
$10 by Christmas
$100 by top of the market pic.twitter.com/aG5OfoanQO
As of November 2024, the memecoin traded at around $2.75–$3.
Contrary to Ansem’s prediction, $WIF nosedived to a low of $0.245 in Q1 2025, only beginning to recover in April.
Still, the community continues showing interest, with renewed activity from spot and derivative traders.
According to CoinGlass, $WIF’s 24-hour trading volume has surged by 85.38%, now exceeding $1 billion.
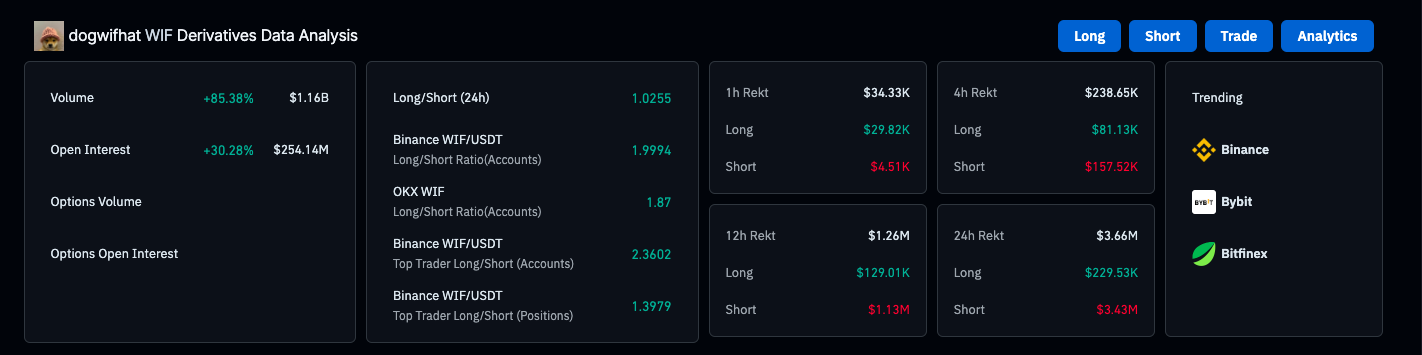
Meanwhile, open interest has jumped by 30%, indicating a fresh wave of derivative speculation and positioning.
Technical Setup: $WIF Bullish Breakout Validates Elliott Wave Structure
In the 4-hour timeframe, $WIF/$USDT has broken out of a corrective structure, forming a textbook 5-wave Elliott pattern, a classic indication of buyer dominance.
The Wave (5) completed an impulsive structure around the $0.50 level, after which the price dipped slightly before being met with strong buying pressure.

$WIF 4H chart shows a 5-wave Elliott pattern/ Source: TradingView
This resulted in a bullish engulfing pattern, a strong reversal supported by high volume, implying that market participants are confident in continuing the uptrend.
From a structural standpoint, the previous corrective wave (labeled as (2)) has now clearly acted as a launchpad, supporting the ongoing bullish breakout.
The RSI Divergence Indicator (14) is currently at 83.24, placing the market in an overbought zone, typically a precursor to a short-term consolidation.
Interestingly, a previous bearish divergence pattern was invalidated as the price powered higher, reinforcing bullish momentum.
Expecting $WIF to hit 80 cents
Taking all the lower targets considered last week, 7wk ema reclaimed (daily been trending slowly)
Could over extend to a $1 we’ll see, but won’t be surprised to see 80cents hit and then a cool off pic.twitter.com/iR1ciNbjGA

The next major resistance lies at $0.57, and if broken with volume, $WIF could test the psychological barrier at $0.60 and could extend toward $0.8
On the downside, $0.50 and $0.45 are key support zones, coinciding with recent consolidation ranges that could provide potential re-entry points.
