Bitcoin Teeters at Critical Two-Year Resistance: Will History Be Made or Broken?

Bitcoin stares down its most pivotal price barrier in 24 months—will bulls smash through or get crushed?
The make-or-break moment: Crypto's flagship asset flirts with a resistance level that's defied every rally attempt since March 2024. Traders are either loading up for a breakout or bracing for another soul-crushing rejection.
Why this resistance matters: This isn't just another technical level—it's the line in the sand separating Bitcoin from price discovery mode or yet another 'buy the rumor, sell the news' fiasco. The last time BTC touched these levels, Elon Musk was still pretending to care about decentralization.
Market psychology at play: Watch for fakeouts. Wall Street whales love painting pretty charts before pulling liquidity like a rug merchant in a bear market. Meanwhile, retail traders are placing leveraged bets like they're using Monopoly money—which might soon be worth more than their altcoin bags.
The cynical take: If Bitcoin breaks through, expect CNBC to suddenly 'discover' crypto again—right after spending two years calling it a dead asset class. The financial media's whiplash-inducing pivots make meme coins look stable.
Bitcoin Price Prediction: Is a Larger Rally Forming?
Bitcoin is currently above $71,000, a critical area that represents the heavy resistance that halted February’s advance.
The bounce from $63,350, confirmed by a Hammer candlestick pattern, showed that buyers are willing to step in at lower valuations.
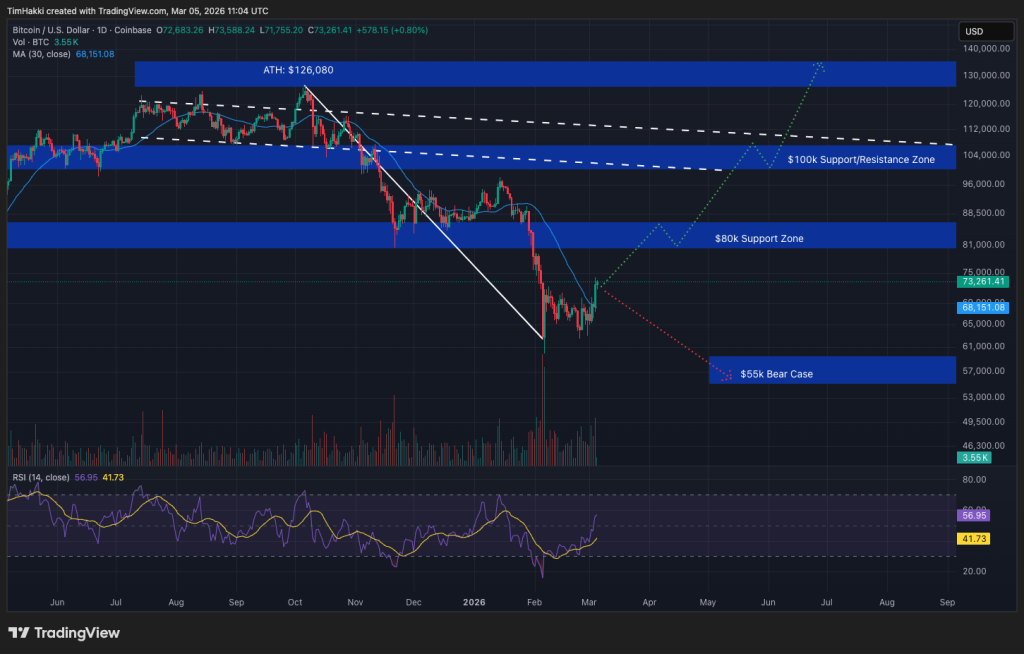
The bearish argument now rests on whether Bitcoin can consolidate recent gains and push ahead to $76,000.
As of this writing, Bitcoin is down 7% on the month, but if the original and biggest crypto can retain value over the next few days, its thirty-day price change will be positive, giving it a stabler platform to go a leg higher.
Bears are watching for “hidden bearish divergence” on the RSI, where price makes a lower high while momentum makes a higher high.
If this divergence plays out and Bitcoin rejects $72,265, the downside targets are steep. Some veteran traders warn a final flush is coming, with technical projection levels sitting as low as $56,800 or even $41,400 if the $62,300 support floor gives way.

However, the bullish invalidation is clear. A sustained close above $79,000 by the end of the week would completely negate the bear flag thesis. Immediate bullish confirmation comes earlier: if BTC can reclaim the $73,000 level and turn it into support, it opens the path to retest the psychological $80,000 handle.
Recent price predictions suggest a move past $72k could trigger a mega rally, provided the volume supports the breakout.
Analyst View: The Line in the Sand
Market analysts are currently split on whether the recent recovery is a dead cat bounce or a genuine reversal. The consensus, however, is that current levels are effectively a “no man’s land” until a decisive break occurs.
To the upside, Bitcoin may have to resurface above its 50-day SMA and reclaim the psychological $80k handle before more buyers are enticed back into the fold.
Other analysts, like Samer Hasn, note that recent extreme fear readings and ETF outflows may have signaled a local bottom, flushing out weak hands in a classic capitulation event.
Bitcoin Resistance Level and Price Prediction: The Levels That Change Everything
Traders should ignore the noise and focus on three specific price levels in the coming sessions. First, watch $74,000. A daily close above this level suggests the 50-day moving average, which has formed a strong resistance zone, is flipping to support.
Second, monitor the support band at $63,000. This is a clear line in the sand for bulls. Losing this level confirms the bear flag breakdown and activates downside targets toward $56,000.
Finally, keep an eye on the invalidation level at $80,000. Reclaiming this zone effectively cancels the macro bearish structure and puts new all-time highs back on the table. The next few daily candles will likely resolve this multi-month tension.
