Glassnode Flags XRP Structure Matching Feb 2022 Pre-Crash Setup - Déjà Vu or Distraction?

Glassnode's latest on-chain analysis throws a chilling signal: XRP's current structural footprint mirrors the setup that preceded its February 2022 collapse.
The Pattern in the Noise
Analysts are zeroing in on specific network metrics and holder behavior patterns. The data doesn't predict the future, but it highlights a concerning statistical echo. Key indicators—from exchange flow dynamics to supply distribution—are aligning in a formation last seen before a significant downturn.
Why This Echo Matters
History in crypto rarely repeats exactly, but it often rhymes. Recognizing these patterns is less about crystal-ball gazing and more about risk assessment. It forces the question: are market participants repeating past behavioral mistakes, or has the underlying asset's fundamental story changed enough to break the cycle?
A Provocative Reminder
For every 'this time is different' narrative in finance, there's a chart pattern quietly laughing in the corner. While long-term believers may see any dip as a buying opportunity, the data serves a cold dose of reality—sentiment and structure can be powerful, and often painful, bedfellows.
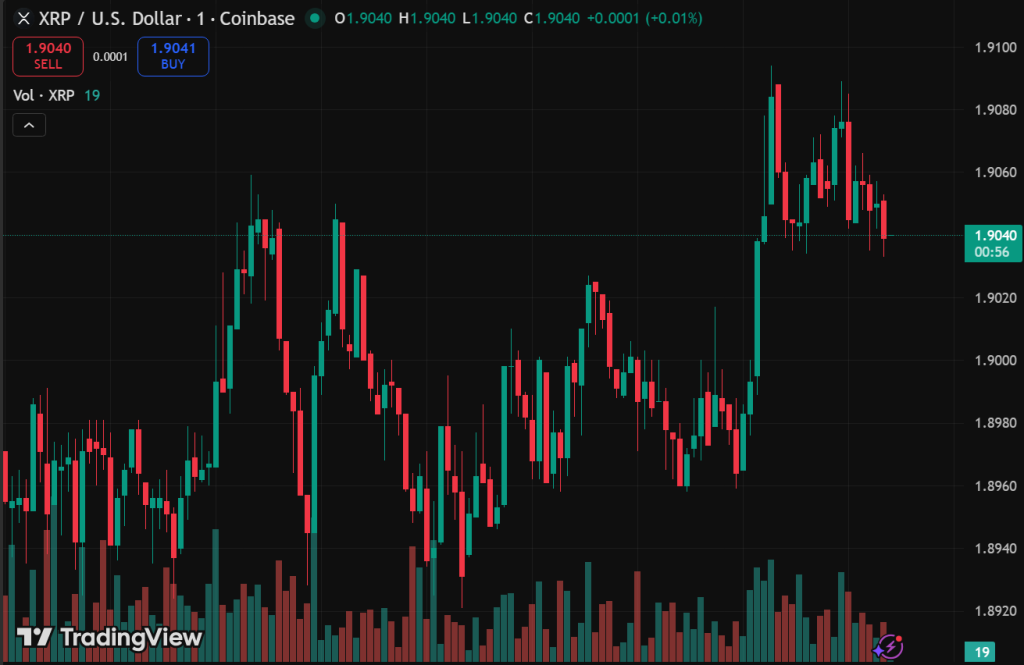 Source: TradingView
The signal centers on the holder’s cost basis. Wallets active in the 1-week to 1-month window are now accumulating below the realized price of the 6-month to 12-month cohort. Newer buyers hold at cheaper entry points while mid-term holders sit underwater or NEAR breakeven.
This relationship creates overhead supply. When spot approaches the mid-term cohort’s cost basis, that group becomes eager to de-risk into any rally. February 2022 showed the result: XRP ran from $0.60 to $0.88 in the first week, then collapsed 60% to $0.30 by mid-year following the Terra implosion and broader macro deterioration.
The $2 Behavioral Threshold
Glassnode identified $2.00 as a level above the technical level. According to the firm’s November 2025 analysis, each retest of $2 since early 2025 triggered $500 million to $1.2 billion in weekly realized losses. Holders consistently capitulated into strength at this zone.
The current market structure for XRP closely resembles that of February 2022.
Investors active over the 1W–1M window are now accumulating below the cost basis of the 6M–12M cohort.
As this structure persists, psychological pressure on top buyers continues to build over time.… https://t.co/8sGXQ8JKnp pic.twitter.com/cQoeFGuQl4
XRP breached $2.40 in early January, up 25% in a week. It has since retreated below $2.00. The pattern is familiar. The token is now trading below its 20-, 50-, 100-, and 200-day moving averages.
The Counter-Data
Positive signs exist. XRP ETFs have absorbed $1.37 billion in cumulative inflows since their November 2025 launch, with 35 consecutive trading days without a single outflow, followed by a modest $40.8 million redemption on January 7. Total AUM sits near $2 billion with over 788 million XRP locked in custody.
Exchange reserves dropped from 3.76 billion XRP in early October 2025 to roughly 1.6 billion by late December, the lowest since 2018. ETF creations require spot purchases, which remove tokens from the available float.
Yet, inflows have not prevented drawdowns. XRP fell 15% in December despite record institutional buying. Exchange balance data shows 206 million XRP (roughly $430 million) moved onto platforms since January began, indicating distribution.
What Desks Are Watching
The February 2022 analog raises a specific question: can ETF-driven supply absorption offset the capitulation mechanics that Glassnode describes? Back then, no spot ETF product existed. Retail holders folded under macro pressure with no institutional bid to absorb supply.
This cycle is structurally different. Five major issuers (Canary Capital, Bitwise, Franklin Templeton, Grayscale, 21Shares) serve pension funds and endowments. Their consistent accumulation has tightened circulating float, and each $1 billion in inflows locks roughly 500 million XRP. But the gap between mid-term and short-term cost bases remains.
If $2.00 fails to hold, the 6-12 month cohort enters deeper loss territory. The $1.80 support level becomes the next line of support. Failure there opens downside toward $1.25, the deeper support zone identified by analysts. A sustained break above $2.40 WOULD invalidate the bearish setup and shift focus toward $3.00 resistance.
