Bitcoin Smashes $94,200 Barrier — Is $100K the Next Stop as Selling Pressure Evaporates?

Bitcoin just bulldozed through a major resistance wall. The $94,200 level—a point where sellers have historically stepped in—has crumbled, signaling a potential power shift from bears to bulls.
The Liquidity Vanishing Act
On-chain data shows a stark drop in sell-side liquidity. Exchange reserves are thinning, and large holders appear to be moving coins into cold storage, not onto the market. It’s a classic hodl signal, suggesting the street believes higher prices are coming.
The Path to Six Figures
With that key resistance shattered, the chart paints a clearer runway toward the psychological $100,000 mark. There’s little in the way of significant technical barriers until that milestone. Of course, in crypto, ‘significant barriers’ can sometimes mean a single tweet from a billionaire—proving once again that finance’s most sophisticated market still dances to the whims of social media sentiment.
The momentum is undeniable. If this supply squeeze holds, Bitcoin isn’t just knocking on the door of six figures—it’s ready to kick it down.
Bitcoin VDD Indicator Shows Long-Term Holders Not Selling
According to on-chain insights shared by Carmelo Alemán, a verified blockchain analyst at CryptoQuant, Bitcoin’s Value Days Destroyed (VDD) indicator, which provides a direct reading of long-term holder behavior, suggests that the recent rally still has room to run.
The VDD metric calculates the number of days bitcoins remained inactive before being moved, weighted by the amount transferred.
Bitcoin Breaks Resistance as Holders Refuse to Sell
“Historically, when Bitcoin’s price rises while VDD remains low, the market tends to be in a healthy expansion phase, where demand absorbs the available supply without generating structural selling pressure.” – By @oro_crypto pic.twitter.com/soss3JTgU0
Currently, VDD stands at approximatelyin January 2026, a historically low level, suggesting that bitcoins being transferred are relatively young, meaning older coins remain untouched.
Practically, this means long-term holders aren’t selling as the price rises.
“This behavior strengthens the quality of the bullish movement, as the price increase is not accompanied by distribution from the market’s most experienced capital,” Alemán explained.
Historically, when Bitcoin’s price rises while VDD remains low, the market tends to be in a healthy expansion phase, where demand absorbs available supply without generating structural selling pressure.
“In this context, the breakout above resistance and continued upward momentum are firmly supported by long-term holder inactivity, reinforcing the idea that the current MOVE is driven by real market strength rather than fragile rebound fueled by short-term speculation,” the analyst added.
A sustained VDD increase would signal long-term holder distribution that could see bitcoin challenge the bears’ last defense at $100,000.
Bitcoin Price Prediction: Weekly Chart Shows Double-Bottom Formation
Cryptonews analysts explained recently that Bitcoin could see a rally, bringing the price well above the $100,000 psychological level, and this aligns with the technical structure on the weekly timeframe.
The 1W Bitcoin chart shows price stabilizing after a sharp corrective phase, with structure still leaning bullish despite recent volatility.
BTC trades around $95,000, having rebounded from the $86,300 region, which aligns closely with the 100-week moving average and marks a critical higher-low zone.
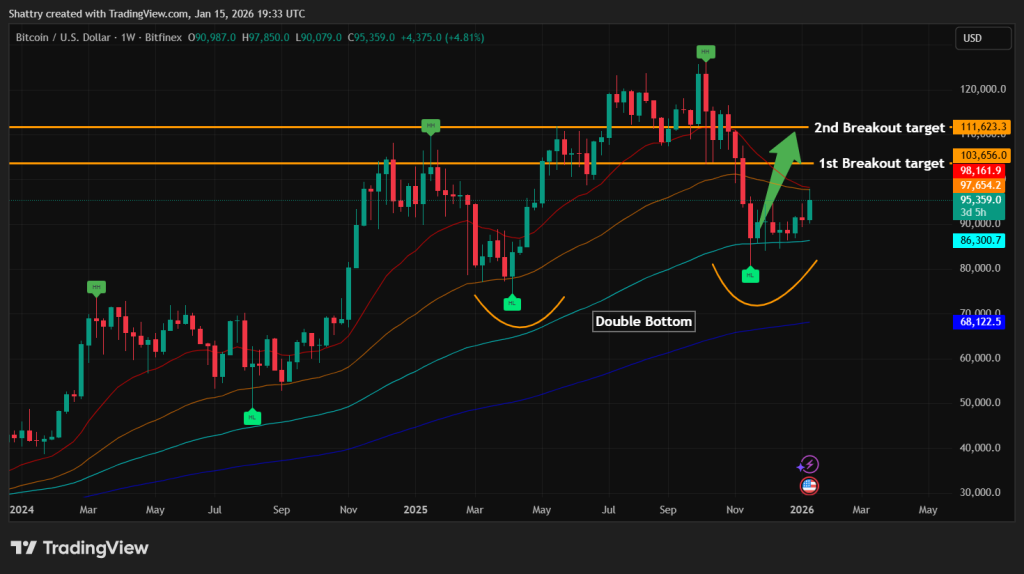
The clear double-bottom formation around this area suggests strong demand absorption and reinforces the notion that long-term buyers are stepping back in rather than capitulating.
From a trend perspective, Bitcoin remains above the 200-week moving average NEAR $68,000, preserving macro bull market structure. However, price currently trades below the, clustered around the $97,600-$98,200 zone.
This area now acts as immediate dynamic resistance, and a decisive weekly close above it WOULD provide early confirmation that bullish momentum is returning.
The horizontal resistance bands at $103,650 and $111,600 represent the most important upside levels.
These zones previously acted as major distribution and rejection areas, making them logical breakout targets if momentum accelerates.
A break above $98,000 would likely shift sentiment decisively bullish, opening pathways for movement toward $103,000 initially, and potentially $111,000 if volume and momentum expand.
New Bitcoin-Beta Project Offers Investors 38% APY Ahead of BTC $100K+ Rally
A Bitcoin breakout above $100,000 would benefit established BTC-beta projects like Bitcoin Hyper positively.
Bitcoin Hyper ($HYPER) develops the first functional LAYER 2 solution for Bitcoin, utilizing Solana-based technology to deliver speed and scalability while preserving Bitcoin’s security model.
The project has raised over $30 million to enable developers to launch Bitcoin-native decentralized applications, providing BTC holders new opportunities to deploy assets productively using on-chain tools built specifically for the Bitcoin ecosystem.

To acquire $HYPER before the next price increase, visit the official Bitcoin Hyper website and connect your wallet (like Best Wallet).
You can swap USDT or SOL for tokens at, or use a bank card.
Visit the Official Bitcoin Hyper Website Here