Bitcoin 2025 Crash: Why This Downturn Looks Nothing Like 2022

Bitcoin's latest plunge has traders flashing back to 2022's brutal bear market—but the parallels end at the price chart.
The Institutional Safety Net
Spot Bitcoin ETFs didn't exist during the last major collapse. Now, they act as a multi-billion-dollar shock absorber. Daily inflows and outflows from giants like BlackRock and Fidelity create a new type of price support—one that's regulated, visible, and backed by traditional finance's deep pockets. The 'crypto bro' panic selling is now competing with institutional rebalancing.
Regulation: From Wild West to Walled Garden
Remember the domino fall of unregulated lenders like Celsius? That playbook is obsolete. Major exchanges now operate under stricter frameworks, with clearer (if sometimes cumbersome) rules on reserves and conduct. The leverage that amplified the 2022 crash has been partly tamed—though never fully eradicated, because some hedge funds will always treat risk limits as a suggestion.
The Macro Picture Plays a Different Tune
2022's crash marched in lockstep with central bank rate hikes. The 2025 downturn is navigating a more complex economic landscape—potential easing cycles, a matured DeFi ecosystem, and Bitcoin's evolving role as a macro asset rather than just a speculative tech bet. It's reacting to different data.
On-Chain Tells a Story of Steady Hands
Check the blockchain data. The movement of long-term holder coins—the so-called 'diamond hands'—shows less panic-driven distribution than in previous cycles. A significant portion of the supply remains dormant, suggesting a core belief in Bitcoin's longer-term thesis hasn't been shattered by this correction.
This isn't a repeat; it's a new phase. The market has aged, institutionalized, and developed calluses. The crash still hurts portfolios, but the patient capital now woven into Bitcoin's fabric is changing how it falls—and, ultimately, how it will recover. After all, on Wall Street, they don't call it a 'correction' until *their* money is on the line.
What Happened in 2022
The 2022 crash began in May, when the Federal Reserve raised rates by 0.5%. Bitcoin traded at about $37,700 at the time. Within days, the TerraUSD stablecoin and its sister token Luna collapsed, wiping out more than $40 billion and sending shockwaves across the industry. Bitcoin fell to $28,900 by May 12, while ethereum slid from $2,779 to around $1,700.
More failures followed: Celsius froze withdrawals, Three Arrows Capital collapsed, and FTX went under in November. By then, Bitcoin had dropped to $15,742 and Ethereum to $880. The total crypto market lost more than $1 trillion in value.
From start to bottom, Bitcoin fell almost 59%. The selloff deepened because of depegs, insolvencies, and high leverage. The recovery was slow and painful, setting the benchmark for what many now call a “crypto winter.”
What Triggered the 2025 Decline
The 2025 correction came from outside crypto. On October 10, President Trump announced a 100% tariff on Chinese imports. Markets reacted instantly. Almost $400 billion was wiped from the crypto market in just 24 hours, the largest daily loss on record.
Bitcoin had hit $126,200 on October 6 but fell to around $110,000 by the end of the month and to roughly $85,000 in late November. By mid-December, it had stabilized NEAR $88,000–$89,700.
November’s 25% drop was Bitcoin’s worst month since 2022. But unlike in 2022, no major crypto project collapsed, no stablecoin depegged, and no major exchange failed. The damage came from macro fears, not internal weaknesses — an important difference.
Price Patterns: 2022 vs. 2025
To compare both cycles, we normalize each one at its trigger point (May 3, 2022, and October 10, 2025).
- In Month 1, both cycles fell at similar speed.
- In Month 2, the paths diverged sharply.
- By Month 3, 2025 shows early stabilization, while 2022 remained unstable.
This gap shows that the 2025 decline is milder and has not entered a full capitulation phase.
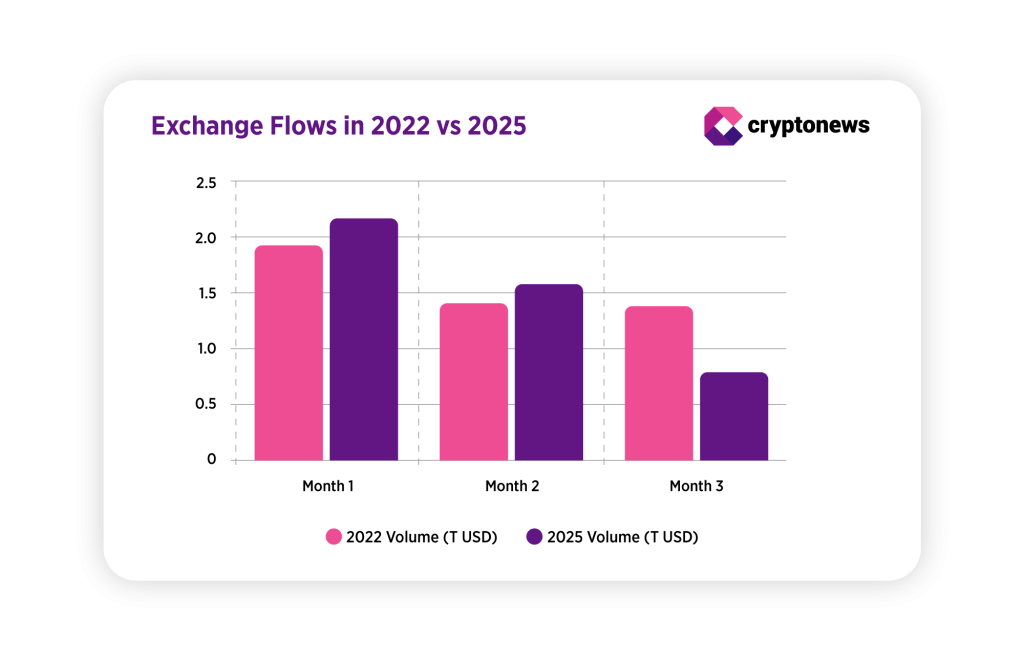
What Exchange Flows Tell Us
Exchange flows are a useful way to read market sentiment. When more bitcoin moves onto exchanges (inflows), it often means investors are preparing to sell. When more Bitcoin leaves exchanges (outflows), it usually points to accumulation or less interest in selling. In 2022, May and June saw heavy net inflows of about 150,000 BTC during the panic that followed the Terra/Luna collapse. At the same time, spot trading volumes on centralized exchanges fell from $1.94 trillion in May to $1.41 trillion in June and $1.39 trillion in July, showing that fewer people were trading as the bear market deepened.
In 2025, the picture is mixed but more stable. Gross inflows in November were high (around 580,000 BTC), but net flows actually turned negative, meaning more Bitcoin left exchanges than entered. This often signals quiet accumulation. Exchange reserves dropped to 2.76 million BTC, suggesting long-term holders and institutions are removing coins from trading venues.
The chart below compares exchange monthly spot volumes. It shows that spot volumes in 2025 remain stronger despite the correction. Binance, for example, saw $7.5 billion in whale inflows over the 30 days from late November to early December. But by mid-December, those inflows had dropped sharply, from 88,000 BTC per day to 21,000 BTC.
If 2025 Repeats 2022, How Long Could Recovery Take?
Bitcoin took 16-20 months to fully recover from the 2022 crash and more than a year from its bottom. Ethereum took even longer.
If the 2025 cycle copies that timeline, recovery could take 12–18 months. Bitcoin could retest the 0.62 normalized level, around $77,500, before reversing.
However, today’s market structure is stronger, liquidity is deeper, and no crypto-native crisis is unfolding. Still, several external forces could influence how quickly the market recovers.
Looking Toward 2026
Expectations for 2026 remain highly uncertain. While some analysts still see room for rate cuts next year, recent Fed projections point to only one at most, and policymakers remain divided. Any easing or liquidity support could help risk assets, though recent moves show that Bitcoin does not always react in a straight line. With steady ETF demand, some forecasts — including JPMorgan’s — still outline scenarios where Bitcoin reaches much higher levels.
At the same time, stickier inflation, stronger U.S. data, and geopolitical tensions could delay policy shifts or keep conditions tight. If ETF inflows cool or institutions turn more cautious, Bitcoin may spend longer moving sideways rather than building a new rally.
