Bitcoin Whales Make Waves: 4-Month High in Long-Term Holder Transfers Signals Bullish Surge

Bitcoin's ancient mariners are stirring—and they're sailing straight into bullish waters.
Long-term holders just moved coins at levels not seen since July 2025, sparking analyst debates about whether this is the calm before the next parabolic storm. These crypto whales typically transfer assets when anticipating major price movements—and right now, they're betting on upside.
The Whale Watch: On-chain data shows long-term holders (LTHs) shifting coins at a pace last seen four months ago. Historically, such activity precedes significant market moves—like clockwork, if you ignore the 37 times it didn't.
Why This Time's Different: Analysts point to the macroeconomic backdrop—rate cuts looming, institutional FOMO rising, and that sweet spot where traditional finance starts pretending they invented blockchain.
The last time LTHs moved like this? Bitcoin rallied 120% in six months. Of course, past performance guarantees nothing—except bonus yachts for hedge fund managers either way.
One thing's certain: when whales dance, retail traders pay for the music. Time to check if your lifeboat's still attached.
Analysts Say Bitcoin’s Whale Transfer Is “Quiet Redistribution”
When long-term whales MOVE coins to exchanges like Binance, it typically signals their readiness to take profits or reallocate positions after prolonged inactivity, which is only a short-term warning sign.
According to ArabXchain, Bitcoin holding NEAR $106,000, despite these whale movements, confirms that the market is experiencing quiet redistribution, not a sell-off.
Older Bitcoin Wallets Move Coins to Binance at Highest Level Since July
“If balance between older deposits and consistent demand from newer maturities persists, we may witness an upward price accumulation in the coming weeks” – By @ArabxChain
Link![]() https://t.co/OXiyM3aLpH pic.twitter.com/qen7Zen1U5
https://t.co/OXiyM3aLpH pic.twitter.com/qen7Zen1U5
“If the balance between older deposits and consistent demand from newer maturities persists, we may witness upward price accumulation in the coming weeks.”
Despite the sharp decline in Bitcoin’s price since the start of November, analysts also observe a bullish pattern.
Inflows into “permanent holder” wallets, addresses with no outflows continue rising steadily.
The realized price of long-term holders has climbed to around $78,520, indicating that institutions, funds, and whales are accumulating even at higher price levels while stronger hands absorb short-term selling pressure.
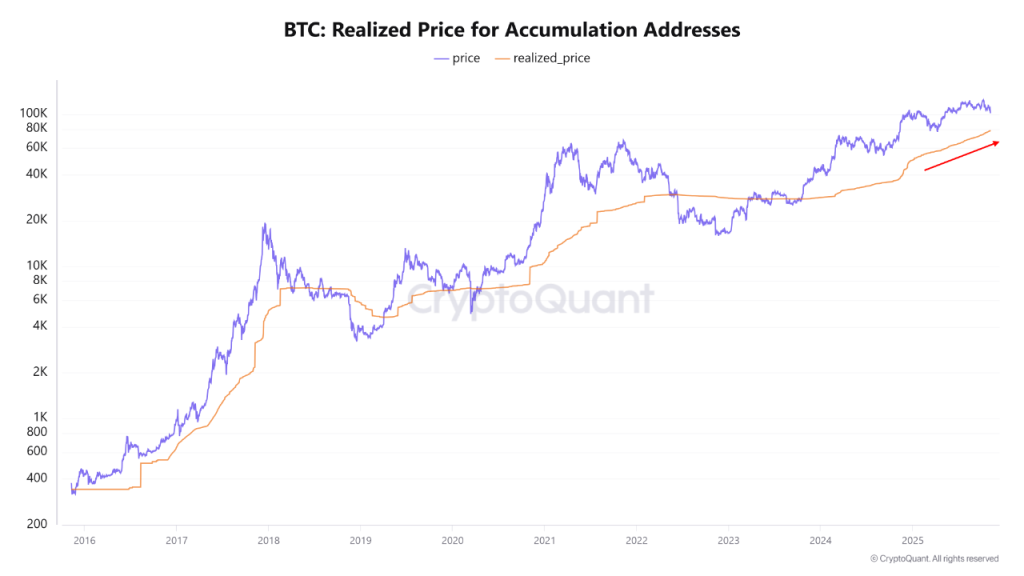
MAC_D analyst on CryptoQuant notes that a true bear market WOULD begin only if Bitcoin breaks below the cost basis at $78,500.
“In the short term, factors such as a potential U.S. government shutdown, equity market corrections, and elevated Korean premium could lead to additional volatility.”
Trump’s $2,000 Stimulus Check Could Pump BTC By 50% in 6 Weeks
That said, the market is now entering a phase of liquidity expansion, supported by rate-cut expectations, the end of quantitative tightening (QT), and rising M2.
After 40 days of deadlock, reports circulating now show that the U.S. government shutdown might be coming to an end.
The US Senate voted 60-40 to advance a bill in a major breakthrough to end the historic shutdown.
The Senate just voted to reopen the government and it’s actually a pretty big deal for how much cash is floating around the financial system right now.
During the shutdown the Treasury (basically the government’s bank account) kept collecting money from taxes and bond sales but… https://t.co/sqMhW2TqoR
Polymarket traders now believe the shutdown will end within the next 3 days.

President TRUMP recently announced the “tariff dividend,” distributing at least $2,000 per American to 85%+ of adults, totaling $400+ billion.
When this happened during COVID, most Americans invested in crypto.
Within 6 weeks, BTC pumped 50% from $6,800 to $10,000, and during the broader 2020-2021 run, BTC went from $3,850 to $69,000, and the total crypto market cap surged from $180B to $3 trillion.
Technical Analysis: $108K Breakout Could Send Bitcoin to $112K
On the technical front, the Bitcoin (BTC/USDT) 1-hour chart shows the price consolidating around the $105,970 level after rebounding from a key support zone near $104,900, identified as the Potential Reversal Zone (PRZ).
This area aligns with the cumulative long liquidation leverage zone, suggesting a region where selling pressure has likely eased and buyers are starting to regain control.
Above the current price, Bitcoin faces a cluster of resistance zones between $108,000 and $112,000, which also coincide with areas of cumulative short liquidation leverage.
The $108,246 level marks a significant 38.2% Fibonacci retracement point; a break above it could signal renewed bullish momentum and open the path toward higher resistance levels near $110,000.
Overall, the short-term outlook leans cautiously bullish as long as BTC holds above the PRZ and $104,900 support area.
However, failure to sustain this level could trigger a retest toward $103,000. A clean breakout above $108,000 would strengthen the case for a trend reversal toward $112,000.
