Bitcoin Soars to $109,500: The Bullish Forces Behind the Rally

Bitcoin just smashed through another psychological barrier—climbing to $109,500 as institutional money floods in. Here’s what’s fueling the frenzy.
The Macro Pump: Traders are ditching gold for digital as inflation fears linger. BlackRock’s ETF inflows hit $1B daily—Wall Street’s late to the party but brought champagne.
Halving Heat: With the 2024 supply cut now biting, miners are hodling tight. Exchange reserves hit a 5-year low while whales accumulate. Classic scarcity play.
DeFi Dominoes: Ethereum’s ETF approval sent altcoins surging, but BTC remains the liquidity king. Even Jamie Dimon’s annual ‘crypto is worthless’ rant couldn’t stop the momentum.
The Cynic’s Corner: Meanwhile, traditional finance still can’t decide if Bitcoin is a ‘risk asset’ or inflation hedge—maybe because it’s busy being both.
ETF Inflows Lead the Charge
According to market data through July 3, spot bitcoin ETFs brought in more than $1 billion in inflows over just two days. Major issuers including BlackRock and Fidelity led the charge, marking a significant shift in institutional appetite. Analysts note that regulated products now hold approximately 40% of Bitcoin’s U.S.-based circulating supply, a factor that continues to tighten available liquidity and apply upward price pressure.
Trade Easing and Liquidity Boost Broader Sentiment
The U.S. government’s MOVE to cut tariffs on Vietnamese goods from 46% to 20% has also lifted market sentiment. The decision is seen as a step toward de-escalating trade tensions and fostering international cooperation. At the same time, U.S. M2 money supply has grown to $55.48 trillion, adding macro liquidity that often finds its way into risk assets like Bitcoin.
READ MORE:
Technical Indicators Confirm Bullish Structure
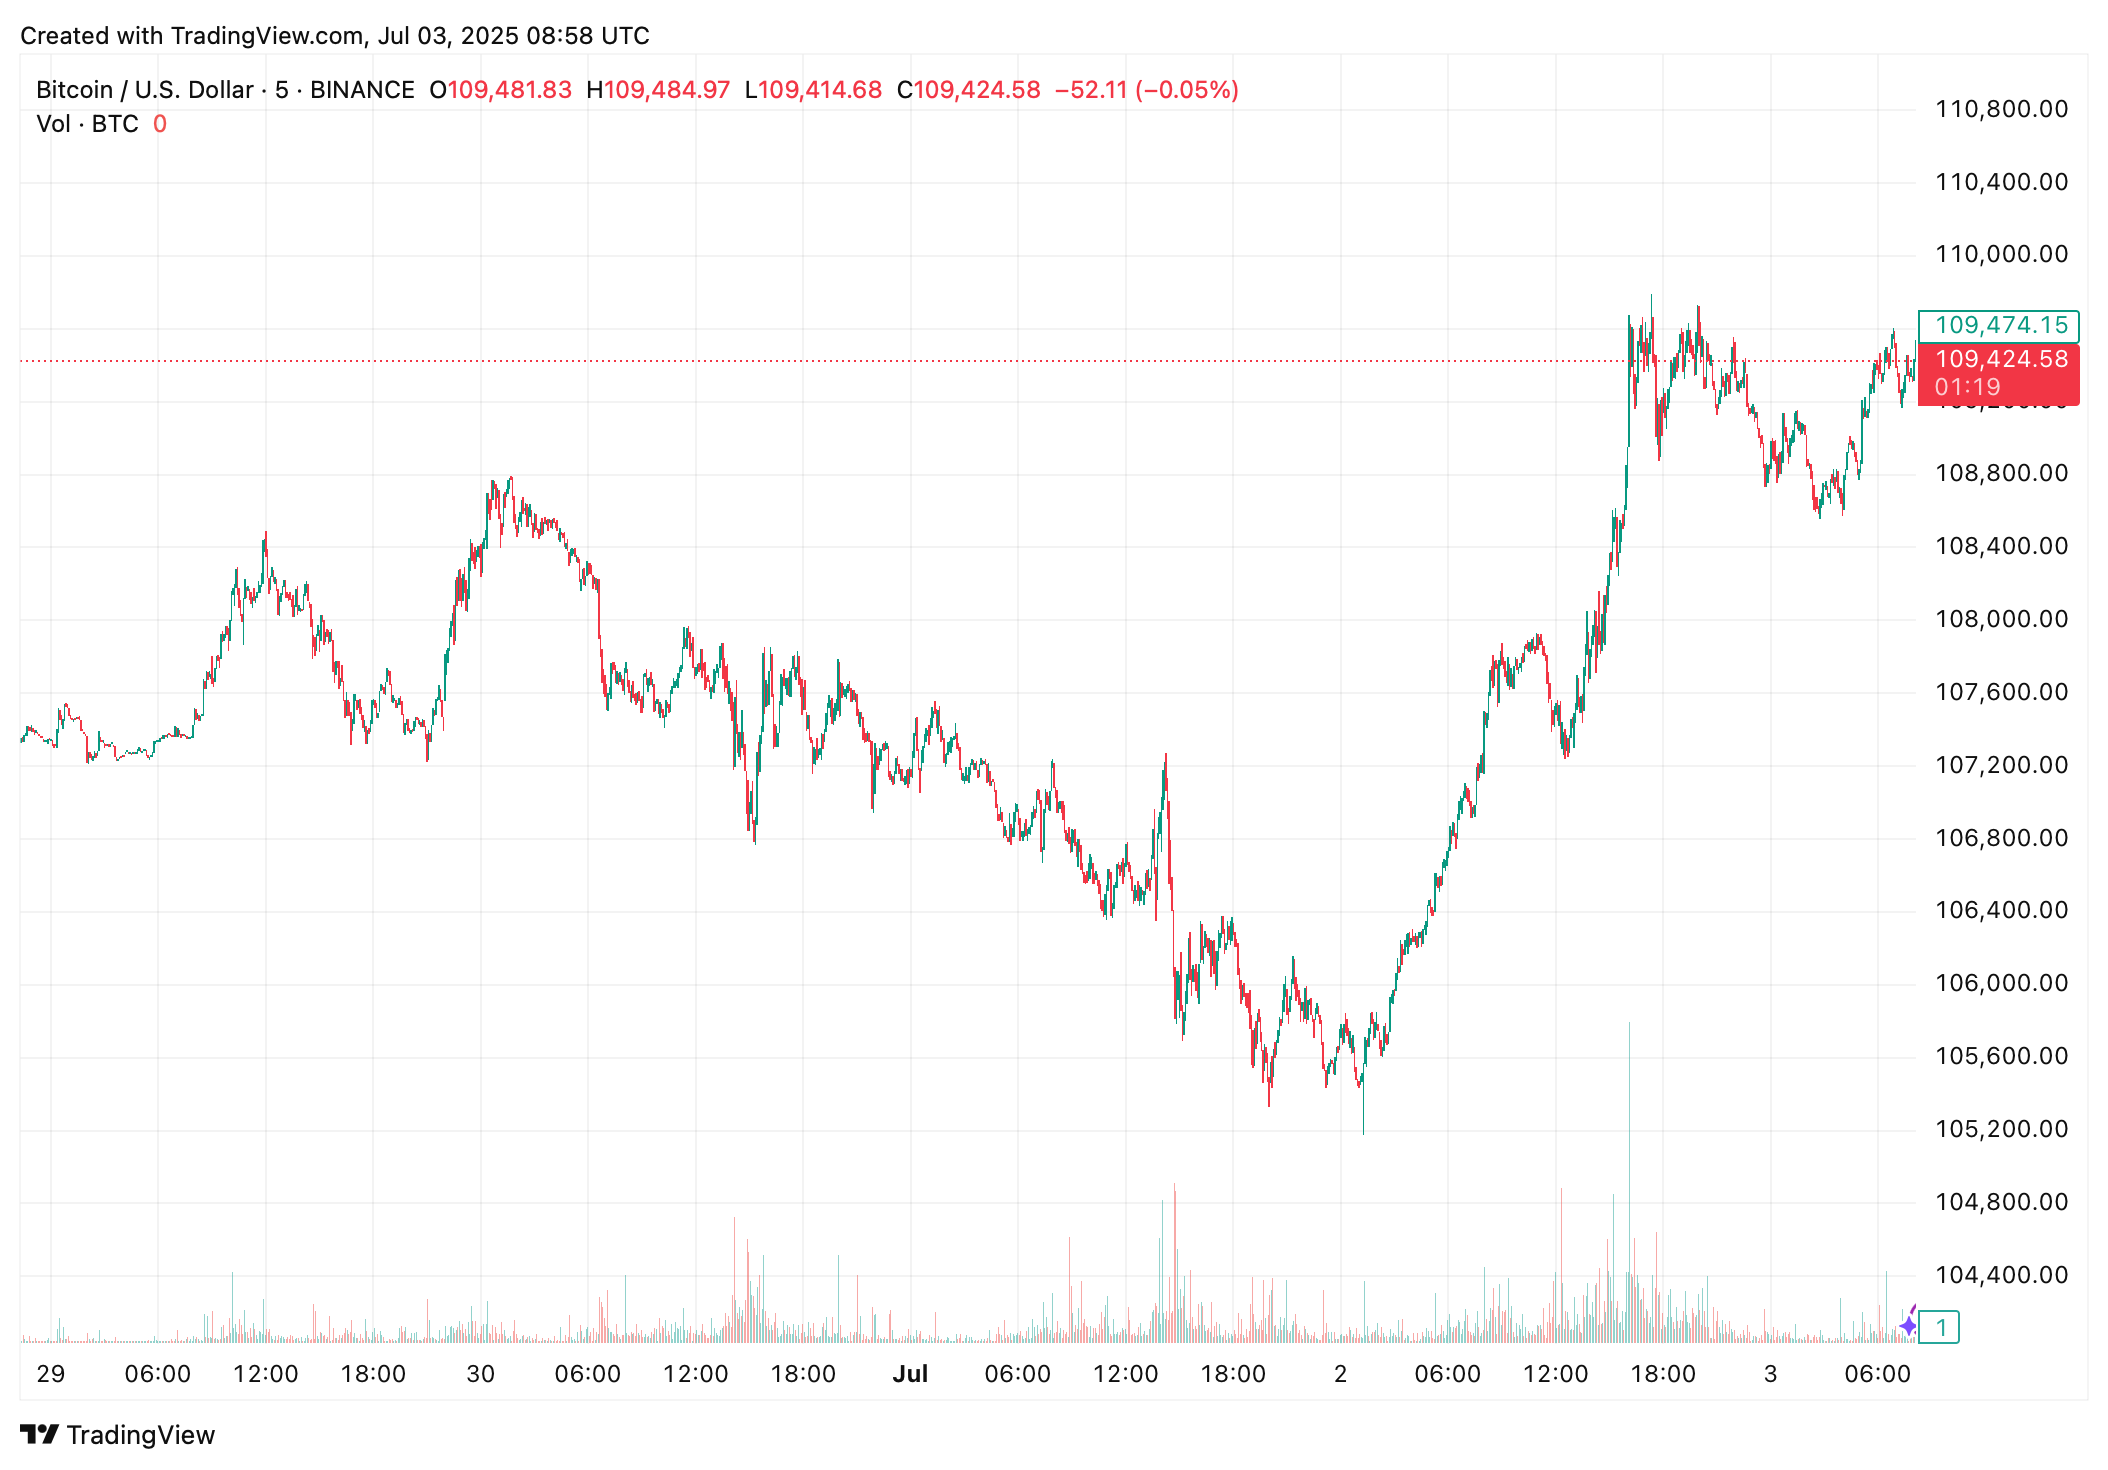
From a charting perspective, Bitcoin has broken above both its 7-day simple moving average (SMA) of $107,350 and 30-day SMA of $105,926, reinforcing a short-term bullish structure. Momentum indicators remain positive, with the 14-day Relative Strength Index (RSI) at 58.32, suggesting more upside potential before overbought conditions are reached. Additionally, the MACD histogram at +240.66 reflects strengthening bullish momentum.
![]()
![]()
![]()