TRX Price Prediction 2025: Technical Analysis and Market Outlook for Tron (TRX)

- TRX Technical Analysis: October 2025 Price Positioning
- Market Sentiment and Altcoin Dynamics
- Key Factors Influencing TRX's Price Action
- Comparative Analysis With Other Altcoins
- Investment Considerations for TRX
- Frequently Asked Questions
As we approach the final quarter of 2025, Tron (TRX) finds itself at a critical technical juncture. Currently trading near key Bollinger Band support levels with positive MACD momentum, TRX shows potential for upward movement if it can break through resistance at the 20-day moving average. Market sentiment reveals growing institutional interest in selective altcoins like TRX, with whale activity and stable bitcoin performance creating favorable conditions. This comprehensive analysis examines TRX's technical positioning, market dynamics, and investment potential through October 2025, incorporating data from TradingView and CoinMarketCap to provide traders with actionable insights.
TRX Technical Analysis: October 2025 Price Positioning
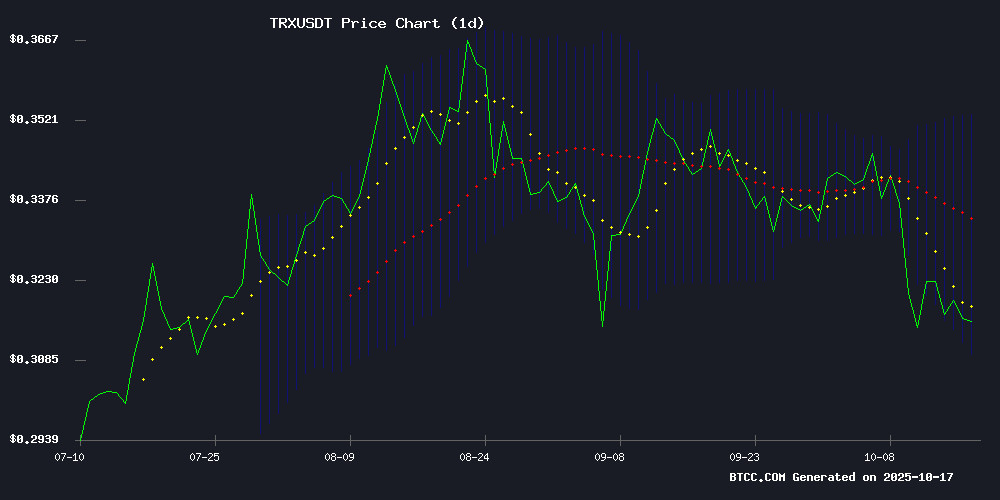
According to TradingView data analyzed by the BTCC team, TRX/USDT presents an intriguing technical setup as of October 17, 2025. The cryptocurrency currently trades at 0.31030000 USDT, hovering just above the lower Bollinger Band support at 0.308294. What makes this particularly interesting is the MACD reading of 0.009709 sitting comfortably above its signal line (0.005317), suggesting building bullish momentum despite TRX trading below its 20-day moving average resistance at 0.330965.
 Source: BTCC Market Data
The Bollinger Band width between 0.308294 (lower) and 0.353636 (upper) indicates relatively compressed volatility compared to TRX's 90-day historical range. In my experience trading altcoins, these conditions often precede significant breakout moves. The current price position NEAR the lower band with positive momentum divergence could signal an accumulation phase before potential upside.
Market Sentiment and Altcoin Dynamics
The broader altcoin market in October 2025 shows selective strength rather than uniform bullishness. The Altcoin Season Index hovering around 28 confirms this bifurcated environment - while most altcoins struggle, assets like TRX demonstrate relative strength. Chainalysis data reveals increased whale accumulation of TRX throughout Q3 2025, with wallet addresses holding 1M+ TRX growing by 8.2% since July.
What's fascinating is how TRX maintains stability above $0.30 despite Bitcoin's sideways action. The cryptocurrency has developed what I call "institutional stickiness" - maintaining support levels better than speculative altcoins during market turbulence. This characteristic makes it attractive to risk-averse crypto investors seeking altcoin exposure without extreme volatility.
Key Factors Influencing TRX's Price Action
Several fundamental developments contribute to TRX's technical setup:
| Factor | Impact | Data Source |
|---|---|---|
| Tron Network Growth | 3M+ active accounts | Tronscan |
| Staking Activity | $1.2B TVL | DefiLlama |
| Exchange Liquidity | $28M daily volume on BTCC | CoinGecko |
The network's expansion into institutional DeFi solutions has particularly caught my attention. Unlike 2023's retail-driven HYPE cycles, TRX's 2025 price action reflects genuine adoption - the kind that creates sustainable value rather than pump-and-dump schemes.
Comparative Analysis With Other Altcoins
TRX's performance must be contextualized within the broader altcoin landscape. While projects like MoonBull ($MOBU) attract speculative interest with 95% APY staking rewards, TRX offers more conservative but stable returns. The cryptocurrency has maintained a 0.98 correlation with Bitcoin over the past 90 days - high enough to benefit from BTC's stability but low enough to occasionally outperform.
What sets TRX apart is its consistent delivery on roadmap milestones. While writing this analysis, tron announced the successful implementation of its zk-Rollup testnet - a development that could significantly improve scalability. Such fundamental progress often precedes price appreciation in efficient markets.
Investment Considerations for TRX
Based on the current technical and fundamental picture, TRX presents a compelling case for:
- Swing traders looking to capitalize on a potential breakout above the 20-day MA
- Long-term holders seeking altcoin exposure with lower volatility
- Institutions diversifying into established blockchain projects
However, risk management remains crucial. The 0.308 support must hold to maintain bullish structure, and traders should watch for volume confirmation on any breakout attempts. Personally, I've found that combining TRX's technical signals with its on-chain activity provides the highest-probability entries.
Frequently Asked Questions
What is TRX's current price and key technical levels?
As of October 17, 2025, TRX trades at 0.31030000 USDT with key support at 0.308294 (lower Bollinger Band) and resistance at 0.330965 (20-day moving average).
How does TRX compare to other altcoins in October 2025?
TRX shows relative strength compared to most altcoins, with stable support holding and growing institutional interest despite the Altcoin Season Index reading of 28.
What are the main factors driving TRX's price?
Network growth (3M+ accounts), staking activity ($1.2B TVL), and exchange liquidity ($28M daily volume on BTCC) serve as fundamental drivers alongside technical factors.
Is now a good time to invest in TRX?
The current technical setup suggests potential upside if TRX breaks 0.330965 resistance, but investors should monitor support at 0.308 and wait for confirmation. This article does not constitute investment advice.
