Bitcoin vs. the VIX: Is BTC Now Wall Street’s Dominant Fear Gauge?

Bitcoin just flipped the script on traditional finance—again. While the VIX has long been Wall Street’s go-to fear barometer, BTC’s wild volatility and macro-defying rallies are stealing the spotlight. Could crypto’s flagship asset now be the market’s true panic button?
The VIX’s identity crisis. Once the undisputed king of risk metrics, the so-called 'fear index' looks downright sleepy compared to Bitcoin’s price swings. Traders are waking up to BTC’s uncanny ability to price in global uncertainty faster than legacy markets can say 'quantitative easing.'
Decoupling or delusion? Skeptics argue Bitcoin’s correlation with risk assets during crashes undermines its safe-haven narrative. But with institutional adoption at all-time highs and central banks still printing money like 2008 never ended, the rules are being rewritten in real-time.
One thing’s clear: When the next crisis hits, Wall Street might check Bitcoin’s price before glancing at the VIX. And that’s before accounting for the fact that—let’s be honest—most finance bros still don’t understand either.
In Brief
- BTC forms bullish setup, repeating a 6-candle consolidation with eyes on $133K.
- Spot Bitcoin ETFs log $6.6B in 12-day inflows, showing record institutional demand.
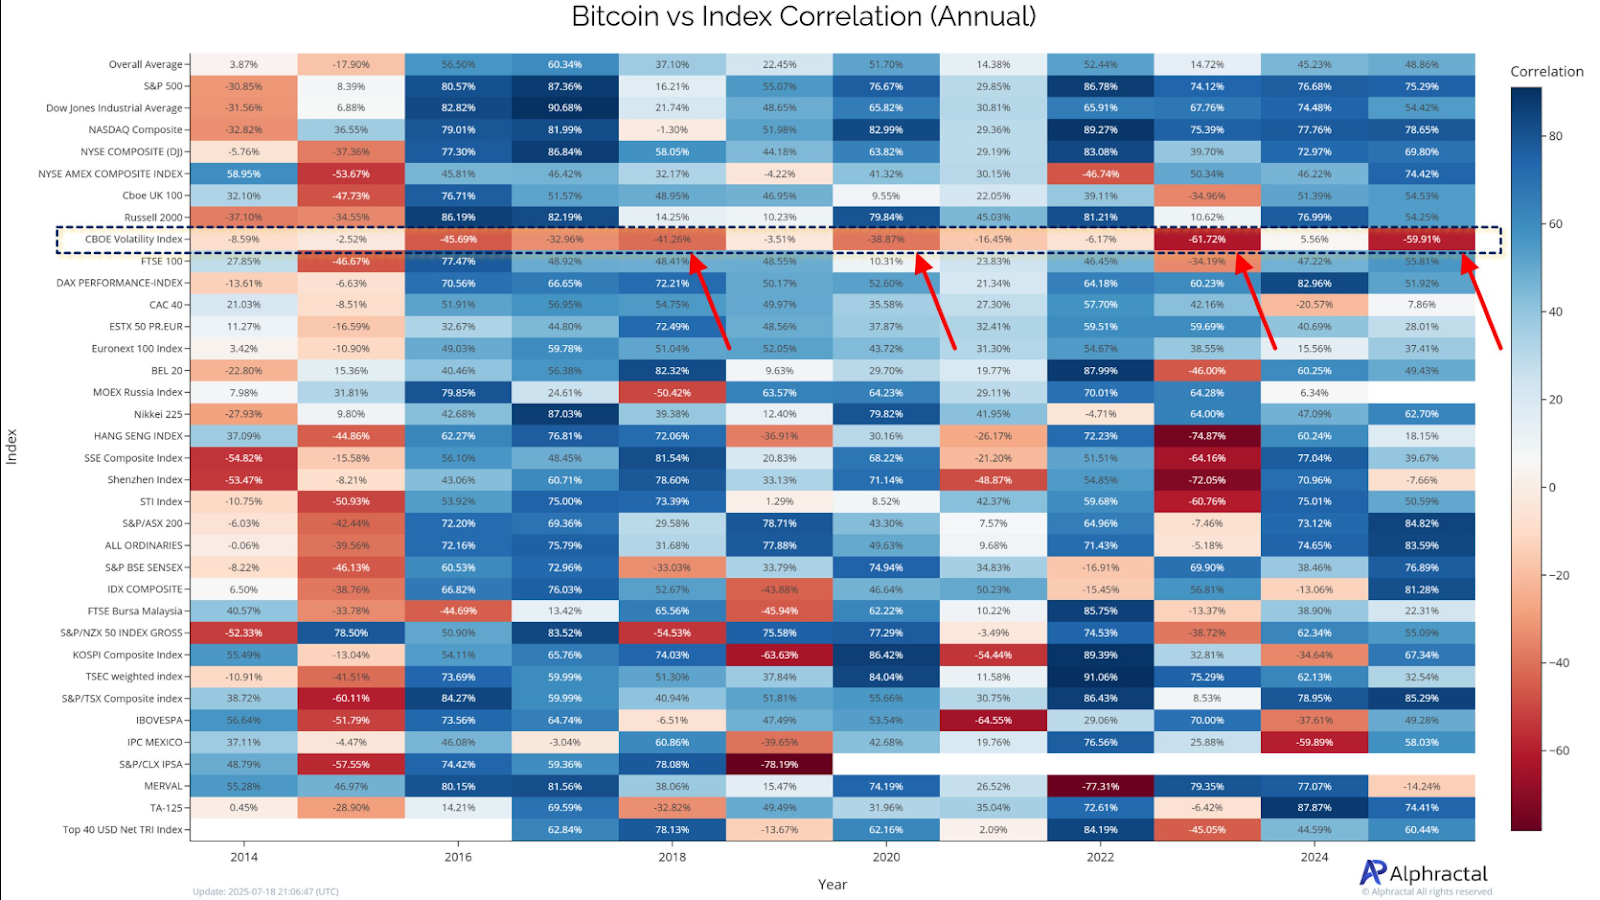
- Bitcoin’s correlation with the VIX has fallen below -59%, hinting at stronger asset independence.
- Low VIX levels may precede increased Bitcoin volatility and potential price acceleration.
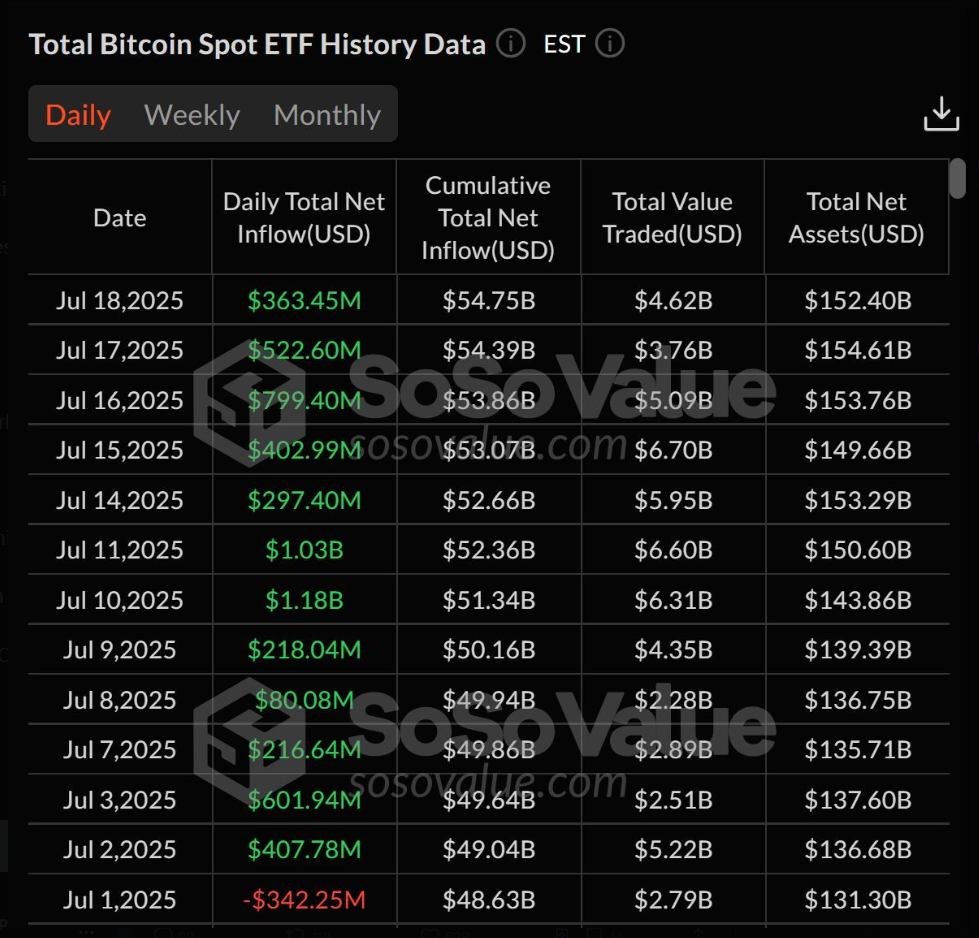
Institutional Investors Drive Spot ETF Growth
As of July 18, total spot BTC ETF net assets surpassed $154 billion, reflecting growing institutional confidence. Volume also stayed elevated, ranging from $3.76 billion to over $6.7 billion daily. This demand continues reinforcing Bitcoin’s supply floor and liquidity strength.
Spot Ether ETFs have also recorded strong momentum over the past two weeks, contributing to the broader trend of institutional accumulation. On Friday alone, ethereum ETFs brought in $402.50 million, pushing total net inflows to $7.49 billion. The streak peaked on July 16 with a record $726.74 million single-day inflow, followed by $602.02 million on July 17, marking Ethereum’s growing appeal alongside Bitcoin in regulated markets.
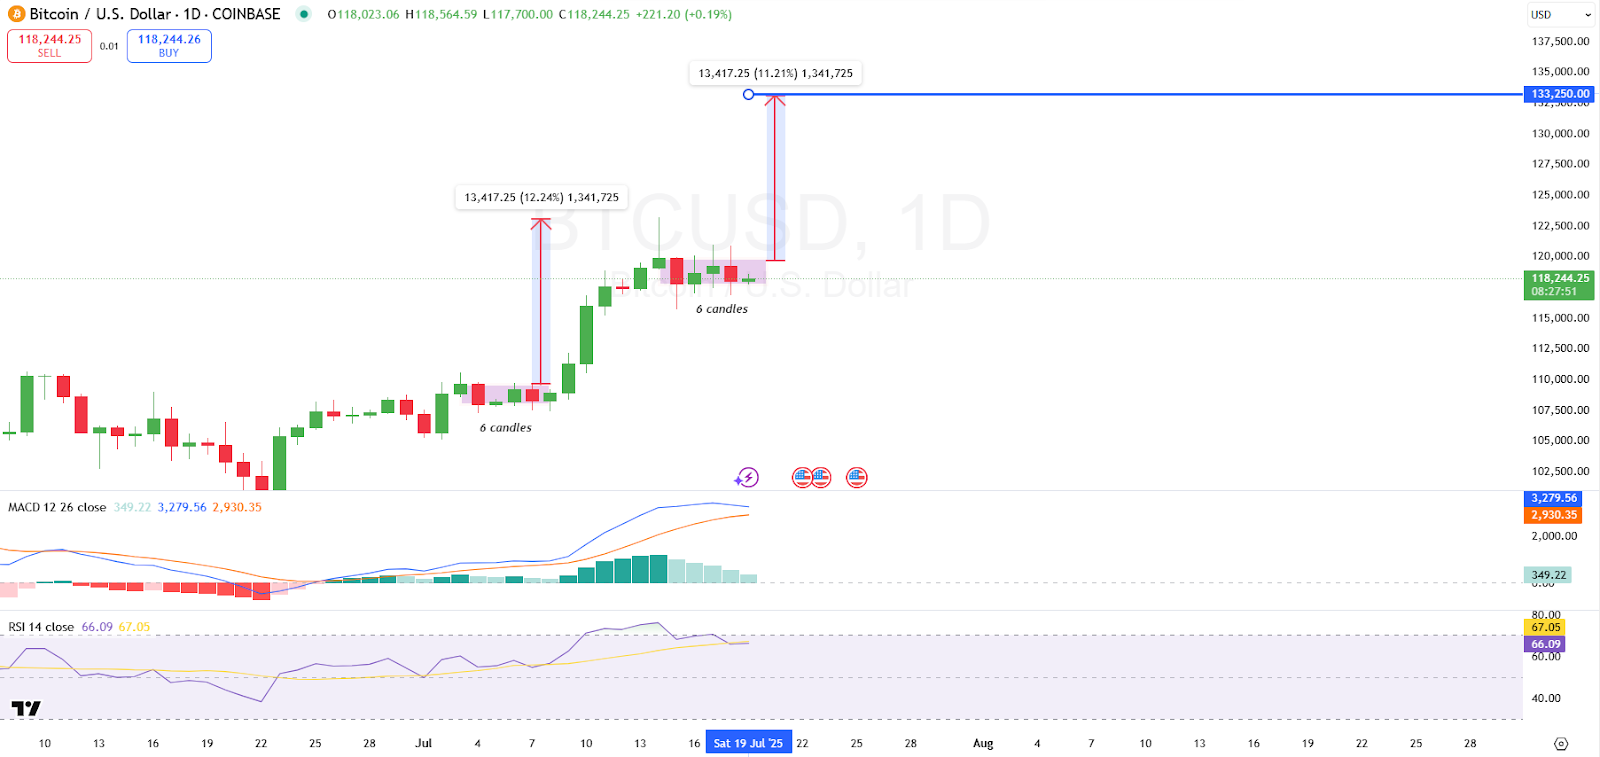
BTC Charts Suggest a Familiar Rally Pattern
The daily chart shows bitcoin forming a bullish structure similar to earlier July action. After a previous 6-day consolidation, the price broke out with a 12.24% rally. Currently, a new 6-candle consolidation range is forming, which may precede an 11.21% breakout toward $133,250.
On the 1-hour chart, Bitcoin has been consolidating within a symmetrical triangle since the all-time high of $123,231 on July 14th and the low of $115,697 on July 15th. This pattern reflects indecision, with lower highs and higher lows tightening into a potential breakout zone.
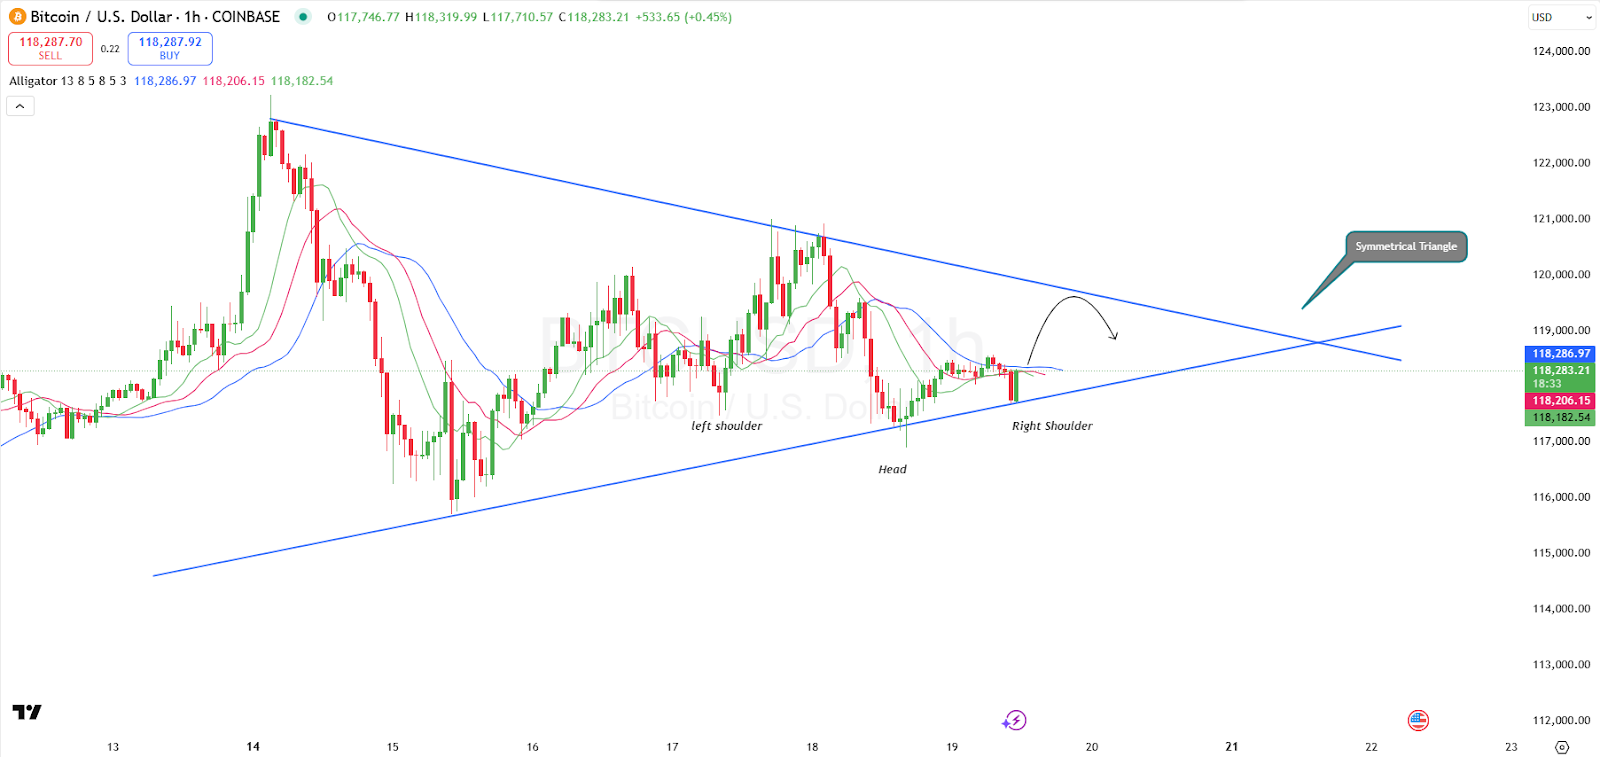
A potential Head and Shoulders pattern has appeared NEAR the triangle’s tip. If confirmed, it could trigger a breakout toward the upper boundary at $119,857. The pattern’s neckline aligns with a key resistance area, which could attract aggressive bids upon a breakout.
The Williams Alligator indicator shows the green, red, and blue lines in tight formation. This signifies suppressed volatility and potential energy buildup. A bullish crossover WOULD validate upward continuation, while a bearish cross could lead to rejection.
BTCUSDT chart by TradingViewVIX Falls as Bitcoin Signals Growing Market Independence
Recent analysis highlights Bitcoin’s increasingly negative correlation with the CBOE Volatility Index (VIX). According to Alphractal, BTC’s 2025 YTD correlation with the VIX stands at -59.91%. Historically, such decoupling periods often precede independent and volatile price movements.
The VIX or the fear index of Wall Street is an index that gauges the volatility of the market by monitoring the S&P 500 options. In case of a low VIX, the traditional markets seem quite calm and Bitcoin tends to become more independent. Such situations have in the past resulted in huge price rallies.
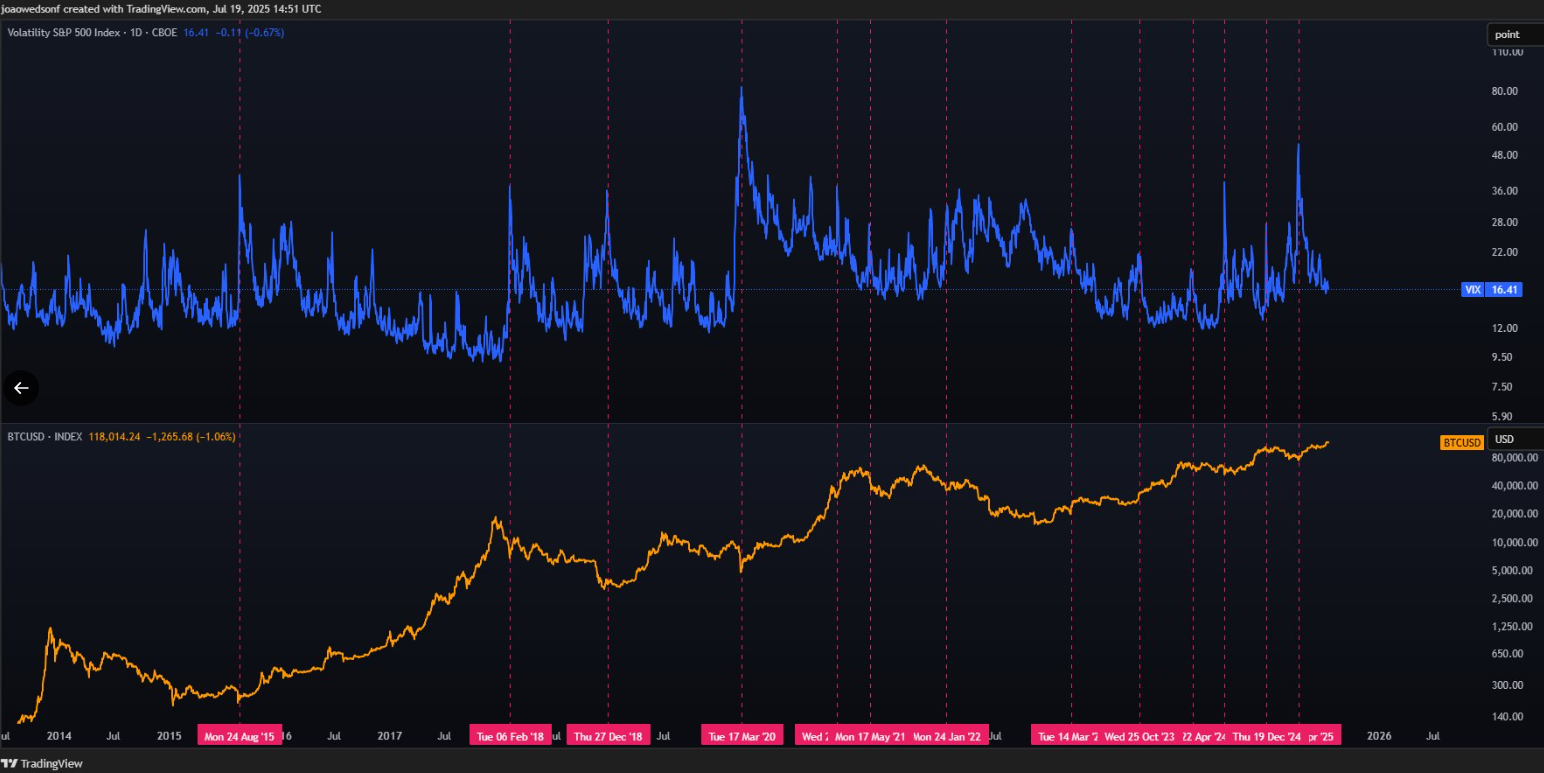
The present VIX rates stand at 16.41, which is the lowest in over a year. The same decline was observed in the previous cycles, e.g., in early 2016, mid-2020, and early 2023. Bitcoin repeatedly went through a different round of increased volatility and directional movement.
This divergence suggests Bitcoin may be evolving beyond the influence of broader equity market sentiment. According to analyst Joao, low-VIX environments shift attention from macro triggers to crypto-native catalysts. The combination of strong ETF inflows and low volatility hints that Bitcoin’s next major MOVE may already be forming.
Maximize your Cointribune experience with our "Read to Earn" program! For every article you read, earn points and access exclusive rewards. Sign up now and start earning benefits.
