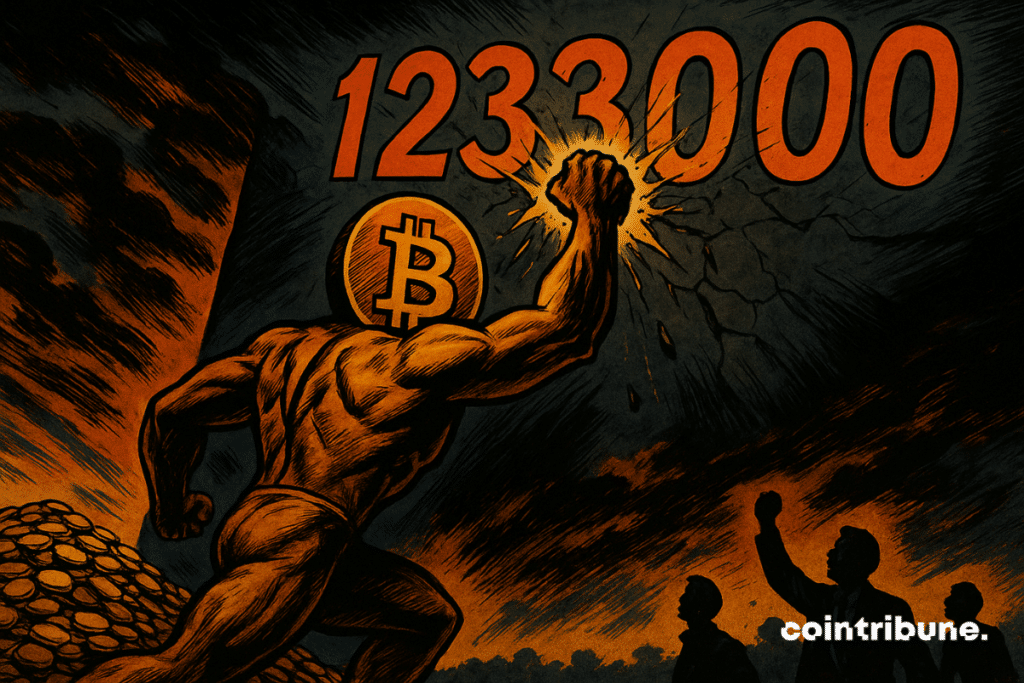
Bitcoin Hits a Wall: Key On-Chain Indicator Signals Tough Resistance Ahead
Bitcoin's bull run just got a reality check. A critical on-chain metric is flashing red—and traders aren't laughing.
The resistance is real
Chain analytics don't lie. The same indicator that predicted the 2024 rally now suggests BTC's upward momentum may stall. Market whales are either accumulating or preparing to dump—nobody's placing bets yet.
Institutions vs. algorithms
Wall Street's shiny new Bitcoin ETFs aren't moving the needle this time. On-chain data reveals retail traders are getting squeezed by algorithmic resistance levels—classic 'buy the rumor, sell the news' behavior.
What happens next?
Either Bitcoin smashes through this barrier like a institutional FOMO rocket... or we get another 'crypto winter' courtesy of overleveraged degens. Place your bets—just don't mortgage your house this time.

In Brief
- Bitcoin failed to break the symbolic $123,000 barrier, despite a new peak at $122,800.
- A key on-chain indicator, Alpha Price, has been identified as the main short-term technical barrier.
- Analyst Joao Wedson points out that this level corresponds to a pressure zone where investors take profits.
- If this threshold is broken, a new bullish target around $143,000 could be considered according to Wedson.
The Alpha Price Threshold : A Difficult Technical Barrier to Break
While bitcoin supremacy is being challenged by ethereum and XRP, analyzing its recent pullback cannot be complete without examining the crucial role played by the Alpha Price indicator, highlighted by Joao Wedson, CEO of the on-chain analysis platform Alphractal. In a post on X, he states : “the flagship crypto price failed to break the second Alpha Price level, which could indicate a short-term loss of momentum”.
Bitcoin Struggles Below Key Alpha Price Level
Bitcoin failed to break through the second Alpha Price level, which currently sits at $123,370—and that's not a great sign for the short term. This level will update tomorrow, as it's dynamically adjusted based on real-time on-chain… https://t.co/q8MWodnwbi pic.twitter.com/KcLioEPFdp
This threshold, located at $123,370, represents according to Wedson a critical resistance level in the context of the current bull cycle. bitcoin stopped just short, at $122,800, its new all-time high, before correcting. According to the analyst, this level acts as a strong selling pressure zone where investors seek to secure their gains.
BTCUSDT chart by TradingViewHere are the main technical elements provided by Wedson’s analysis :
- The Alpha Price is an on-chain indicator that takes into account the market age in days and the historical average market capitalization of bitcoin ;
- It breaks down into several dynamic thresholds, called “Alpha levels,” which act as zones of psychological pressure ;
- The $123,370 threshold corresponds to the second Alpha level, considered a major resistance in a bull market phase ;
- This level has never been sustainably breached so far, which limits the probabilities of a bullish extension in the very short term ;
- Joao Wedson specifies, however, that this failure does not necessarily mark a market top, but likely requires a retreat before any new breakout attempt.
Technical analysis therefore suggests that bitcoin could remain under pressure as long as it has not clearly validated this level as support. Until then, the market seems engaged in a breathing phase, with medium-term bullish potential if on-chain conditions improve.
The Awakening of a Satoshi Era Wallet and Its Domino Effect
Alongside this technical resistance, a very rare event cooled bullish enthusiasm: the awakening of a whale from the Satoshi era, the earliest years of bitcoin’s life.
On July 17, a wallet inactive for over ten years suddenly moved its funds, causing an emotional and speculative shock within the market. Such activity is generally seen as a warning signal, as it suggests very old holders, often regarded as historical figures of the network, might be considering selling.
This unusual transaction occurred at a particularly sensitive moment: just after BTC was rejected at the $123,000 level. The effect was immediate. Within 24 hours, bitcoin’s price dropped over 2 %, falling back below $118,000.
Although no massive sell-off was confirmed, the mere movement of these funds sufficed to trigger a climate of caution, illustrating the fragility of market sentiment in a zone of high volatility.
This revived nervousness, combined with the previously mentioned technical failure to break through, opens the door to a short-term consolidation scenario. However, an imminent reevaluation of the Alpha Price indicator could potentially raise the critical thresholds. If so, and if on-chain flows resume a positive trend, the bullish scenario mentioned by Wedson, with a target of $143,000, WOULD remain conceivable, especially with a new golden cross detected.
Maximize your Cointribune experience with our "Read to Earn" program! For every article you read, earn points and access exclusive rewards. Sign up now and start earning benefits.

