Cardano Outpaces Ethereum in Developer Surge—Is an ADA Price Rally Next?

Cardano’s GitHub commits just flipped Ethereum’s—a rare feat signaling robust protocol development. While ETH’s devs juggle scaling fixes, Cardano’s team ships code like a startup on deadline.
Price implications? Bullish, but with caveats. Developer momentum often precedes price action (see Solana’s 2023 rebound), but ADA’s 90-day chart still smells like a crypto hedge fund’s lunch money—volatile and unpredictable.
Key detail: Cardano’s 30% dev-activity lead over Ethereum includes core upgrades, while ETH’s focus remains fragmented between L2s and sharding. Builders build, but traders? They’ll need more than GitHub charts to ditch Ethereum’s liquidity moat.
Bottom line: This isn’t some vaporware chain begging for attention. Real code, real growth—yet in crypto, even fundamentals bow to Bitcoin’s next mood swing.
ETH’s Downfall
Cardano founder Charles Hoskinson has further fueled this narrative by issuing a stark prediction: he anticipates Ethereum will face a significant downturn by 2040. Hoskinson attributes this to Ethereum’s “outdated tech,” layer 2 fragmentation, and now, its falling behind in developer activity.
Cardano Founder: "I don’t think #Ethereum will survive more than 10 years." pic.twitter.com/BB1QRmhM2k
— Altcoin Daily (@AltcoinDailyio) April 23, 2025
He suggested Ethereum needs to reconsider its accounting model, virtual machine, and consensus mechanism, advocating for a shift towards technologies similar to Cardano’s Ouroboros-Leios and RISC-V based virtual machines.
The core of his concern, however, lies in Ethereum’s lack of effective on-chain governance, which he believes will hinder its ability to adapt and evolve, ultimately leading to its decline within the next 10 to 15 years as competing ecosystems gain traction.
ADA Price Analysis
According to CoinMarketCap data, ADA trades at $0.70, hovering around the 0.618 Fibonacci level ($0.6910). A sustained hold above this level could indicate continued bullish momentum, potentially targeting the 1 Fibonacci level at $0.7533 and then the 1.618 level at $0.8509.
Conversely, a break below the 0.618 level could see price retrace towards the 0.5 Fibonacci level ($0.654) and potentially lower.
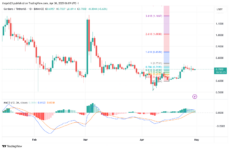
ADA Daily Chart | Source: TradingView
The MACD (Moving Average Convergence Divergence) indicator shows the MACD line (blue) crossing above the signal line (orange), and both are currently above the zero line. This generally indicates bullish momentum is building.
The increasing height of the green histogram bars further supports this positive momentum. However, it’s important to note that the MACD lines are still relatively close, suggesting the momentum is not yet overwhelmingly strong and could be subject to change.
nextCardano Tops Ethereum in Core Developer Activity, Will ADA Price Soar?

Log in to Reply
Log in to comment your thoughtsComments
Related Articles
|Square
Get the BTCC app to start your crypto journey
Get started today Scan to join our 100M+ users