Ethereum’s Make-or-Break Moment: ETF Staking Hinges on Monster Rally

ETH bulls are running out of runway—the network needs a jaw-dropping price surge to justify Wall Street’s staking gambit.
Here’s why the math looks brutal: post-merge inflation dynamics mean Ethereum must attract institutional capital at levels that’d make even Bitcoin ETF flows blush. Otherwise, those ’yield-generating’ ETF pitches start smelling like overpriced DeFi vaporware.
The kicker? SEC approval was supposed to be the hard part. Now comes the real test—getting TradFi to care about validator rewards when Treasury yields are still eating crypto’s lunch.
Whales Sell, Traders Wait
Notably, Ethereum did record a short-lived rally earlier this month, bouncing from $1,438 to $1,840. However, on-chain data shows whales offloaded 262,000 ETH, worth around $445 million, between April 9 and April 26.
Whales took advantage of the recent price surge, selling 262,000 #Ethereum $ETH, worth around $445 million. pic.twitter.com/sQ0PhAzyfX
— Ali (@ali_charts) April 29, 2025
This distribution phase has affected bullish sentiment amid growing ETF staking talks. Balchunas argued that another sharp rally could quickly shift the ETF landscape.
At the time of writing, Ether is trading around $1,805, down by around 1% in the past day. Popular crypto YouTuber Crypto Rover states that the second-largest cryptocurrency is “insanely” undervalued.
$ETH is insanely undervalued! pic.twitter.com/aPFtYDkhZk
— Crypto Rover (@rovercrc) April 30, 2025
ETH Price Outlook
On the daily ETH price chart, the SuperTrend indicator is still flashing a “Sell” signal. A daily close above $1,950 is essential to flip this into a bullish confirmation.
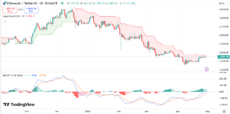
ETH price chart | Source: TradingView
MACD has crossed into positive territory, suggesting momentum may be building. However, the histogram’s height warns of slowing upward pressure. If the token breaks above the $1,950 zone, it could ses a rally to $2,120.
RSI stands at 55.66 with an upward gradient, indicating a mild bullish bias with sufficient room for bulls.
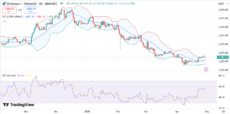
ETH price chart | Source: TradingView
Bollinger Bands are beginning to widen after a squeeze, hinting at a potential breakout. The price is approaching the upper band near $1,880. However, failure to hold above the mid band (20-day SMA) at $1,730 could lead ETH to $1,680 and potentially to the $1,600 zone.
Meanwhile, the ETH/BTC pair is currently at a historic Bottom. Several analysts have projected that the struggling period for the token could be over and suggested investors buy the dip.
nextEthereum Needs Massive Rally for ETF Staking to Materialize Further Gains

Log in to Reply
Log in to comment your thoughtsComments
Related Articles
|Square
Get the BTCC app to start your crypto journey
Get started today Scan to join our 100M+ users