Solana (SOL) Eyes $3K Breakout as Analysts Spot ’Ridiculously Bullish’ Chart Pattern

Solana’s SOL token is flashing a technical setup that could send prices soaring past $3,000—if you believe in the magic of squiggly lines on charts.
The Pattern That Has Traders Foaming at the Mouth
A descending wedge breakout on the weekly timeframe suggests SOL might soon moon harder than a degen ape’s first leverage play. The same pattern previously preceded Solana’s 2021 12,000% pump.
But Here’s the Fine Print...
Of course, this assumes crypto markets will once again defy gravity, fundamentals, and common sense—just like Wall Street does every time the Fed whispers ’quantitative easing.’
Big money is quietly pouring into solana
Meanwhile, recently, three different investment firms invested a total $300 million into the Solana ecosystem, underscoring growing confidence in the ecosystem.
GSR spearheaded a $100 million private investment in UPEXI to drive a Solana-based treasury strategy, while Astra Fintech launched its own $100 million fund targeting Solana innovations. Additionally, Galaxy Digital completed a slow but deliberate $100 million swap from ETH into SOL over two weeks via Binance.
SOL Strategies also recently secured up to $500 million from ATW Partners specifically to acquire SOL tokens for staking. RockawayX, a Prague-based venture firm, announced a new $125 million fund aimed at Solana developers.
Sol price outlook
On the daily SOL price chart, the RSI sits around 63 with an upward gradient, signaling bullish momentum. This leaves room for further gains before exhaustion kicks in.
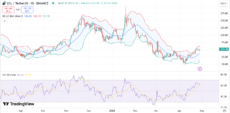
SOL price chart | Source: TradingView
Bollinger Bands are tightening slightly after expansion, suggesting that traders could see a breakout move ahead. Price action is testing the upper band, indicating strong buying pressure.
If SOL fails to hold this level, it could retrace toward the $135-$140 support zone before attempting another breakout.
Meanwhile, the MACD is also flashing bullish signals, with the MACD line trending above the signal line and positive histogram bars building up.
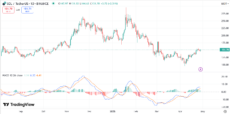
SOL price chart | Source: TradingView
Traders could notice a potential ascending triangle forming, with higher lows converging toward the $153-$154 resistance. A breakout above this level could unleash a rally toward the psychological $200 level.
nextSolana (SOL) Price to Cross $3K? Analyst Highlights Massively Bullish Pattern

Log in to Reply
Log in to comment your thoughtsComments
Related Articles
|Square
Get the BTCC app to start your crypto journey
Get started today Scan to join our 100M+ users