Global Liquidity Tsunami: Is Bitcoin Primed for an Epic Bull Run in 2025?

Central banks flood the system—Bitcoin stands ready to surf the wave.
The Liquidity Engine Ignites
Massive monetary injections traditionally fuel risk assets. Bitcoin—digital gold meets speculative rocket—catches the overflow when traditional markets choke on cheap cash. Watch the money supply metrics tick upward; watch crypto portfolios swell.
Market Mechanics Exposed
Institutional players pivot from bonds to blockchain when yields collapse. Retail FOMO kicks in around all-time highs. The cycle feeds itself—liquidity begets leverage, leverage begets lunacy. Same script, different actors.
Regulatory Wildcards Loom
Never count out regulators crashing the party with paperwork and pronouncements. They'll likely be late, wrong, and loudly bureaucratic—classic finance theater.
Positioning for the Pump
Forget fundamentals when the printing presses hum. Technicals trump all in a liquidity-drunk market. Chart the flows, track the whales, and for heaven's sake—take profits before the suits on Wall Street remember they hate crypto.
Another cycle, another chance to watch digital scarcity mock monetary policy. The irony's thicker than a central banker's emergency statement.
After a strong rise and fall, the Bitcoin price is consolidating above $115,000, and it appears to have landed in a decisive phase. Regardless of this, the market participants continue to remain optimistic as a bigger force is about to drive the BTC price rally. The global liquidity, as measured by M2, which represents the amount of money circulating through the world’s financial system, has reached a significant range where a bearish deviation could harm the BTC price rally.
Right now, that liquidity is stuck under a downward resistance line, showing that money supply growth is limited. Bitcoin is reacting similarly, trading sideways and waiting for a clear signal. If global liquidity breaks higher, it could fuel Bitcoin’s next big rally toward six figures. But if liquidity gets rejected again, Bitcoin may remain stuck in a long period of consolidation.
Liquidity and Bitcoin: A Proven Correlation
When it comes to Bitcoin, liquidity is often the invisible hand guiding every major move. The M2 money supply, which measures the amount of cash, savings, and near-money assets in circulation, has shown a direct relationship with Bitcoin’s price over the years.
Whenever liquidity expands, risk assets thrive. Investors with more capital tend to move beyond traditional markets and seek higher returns in assets like Bitcoin. On the other hand, when liquidity contracts due to tighter central bank policies, bitcoin usually struggles as speculative capital dries up.
- 2017 Bull Run: A surge in credit growth and global liquidity helped Bitcoin break past $20,000 for the first time.
- 2020–2021 Rally: Record-breaking liquidity injections during the pandemic fueled Bitcoin’s historic climb to $69,000.
- 2022 Crash: As central banks tightened policy and liquidity shrank, Bitcoin plunged to $15,000.
The message is clear: Bitcoin’s biggest rallies and deepest corrections have all lined up with shifts in global liquidity. This makes the current setup—with liquidity pressing against long-term resistance—a critical turning point not just for Bitcoin, but for the wider crypto market.
What’s Next for the Bitcoin Price Rally?
After the latest pullback, the BTC price not only faced a decent pullback from the highs but also dragged the levels below the pivotal support. This breakout from the pattern need not be considered as a bearish reversal but the beginning of a fresh bullish wave. The price still holds above an important support, and until the bulls defend this price zone, the possibility of a bullish reversal may remain high.
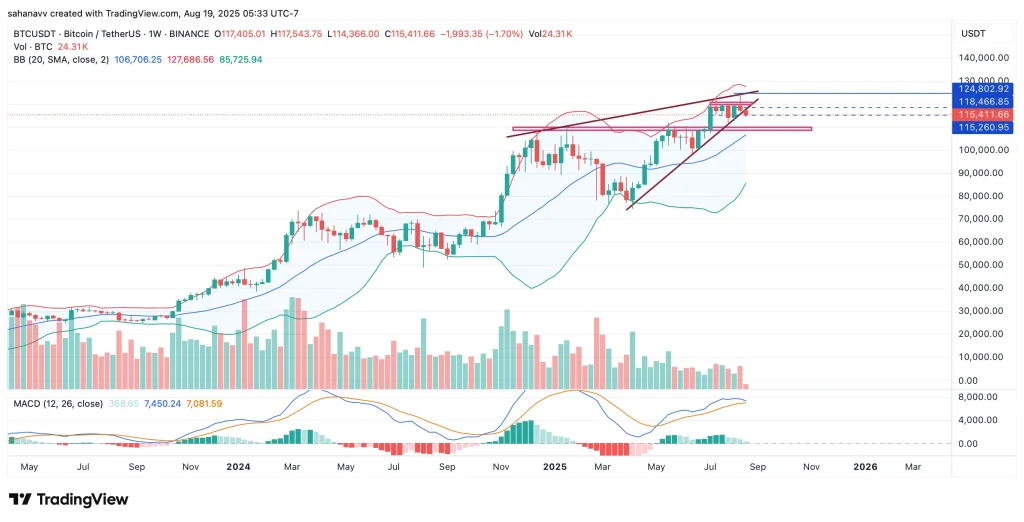
- Bitcoin is moving inside a rising wedge pattern, often a bearish setup, with price compression near the upper boundary, displaying the possibility of a breakdown
- Strong support around $115K–$118K and key resistance near $124K–$127K—a breakout or breakdown will set the next direction.
- Price is hugging the upper Bollinger Band, showing strong momentum but also risk of a pullback toward the middle band (~$106.7K).
- The MACD is still positive but flattening, suggesting slowing bullish momentum and risk of a bearish crossover.
- Bitcoin remains above the 20-week SMA (~$106.7K), which continues to act as long-term bull market support.
Bitcoin’s future isn’t only tied to its adoption curve but also to global capital conditions. With liquidity at a technical decision point, traders should focus less on short-term noise and more on the upcoming breakout. The M2 Liquidity Index could once again be the leading signal of Bitcoin’s next major cycle—whether bullish or bearish.
