OKB Skyrockets 129% in 24 Hours—Is a $103 Correction Looming?

OKB just pulled off a jaw-dropping 129% rally in a single day—now traders are bracing for a potential plunge to $103. Here’s the breakdown.
The parabolic pump
Exchange tokens are heating up, and OKB’s vertical climb left even seasoned degens blinking at their screens. No major news, no ecosystem bombshell—just pure, unfiltered market chaos.
The FOMO trap
Retail piles in whenever green candles go brrr, but smart money’s already eyeing exits. Liquidity pools near $103 suggest whales might be setting up a classic ‘buy the rumor, sell the news’ play.
The cynical take
Another day, another token mooning while traditional finance bros cry into their spreadsheets. Remember: what goes up 129% in crypto usually comes down twice as fast.

OKB has stunned the crypto market with one of its sharpest rallies to date. The token soared 129.9% in just 24 hours, to mark its foot at a new all-time high of $139.76. However, it has now cooled to around $107.30. The bulls have managed to push its market cap to $6.43 billion and driving 24-hour trading volume to $1.41 billion, which is an unprecedented surge of 15,764%.
It is worth noting that, while momentum is undeniably strong, technical indicators point to the possibility of near-term volatility. Wondering what led to the price surge, and how far could OKB Price go? Then this analysis is a must-read for you.
Why is OKB Price Surging?
OKX has burned 65.26 million OKB, over 52% of the circulating supply, thereby permanently capping total supply at 21 million. This aggressive reduction has created immediate scarcity, aligning OKB with Bitcoin’s deflationary narrative and attracting investors seeking “digital scarcity.”
The Ethereum-compatible X LAYER blockchain now supports 5,000 transactions per second with near-zero fees. As OKB serves as its gas token, the upgrade could boost organic demand. However, the phased shutdown of OKTChain, which aims at converting OKT to OKB introduces potential sell-side pressure from token migration.
OKB Price Analysis
On the 4-hour chart, I’ve shared, OKB price broke above the 23.6% Fibonacci retracement level at $117.26 but is now consolidating below it. The RSI-14 reading of 78 signals extremely overbought conditions.
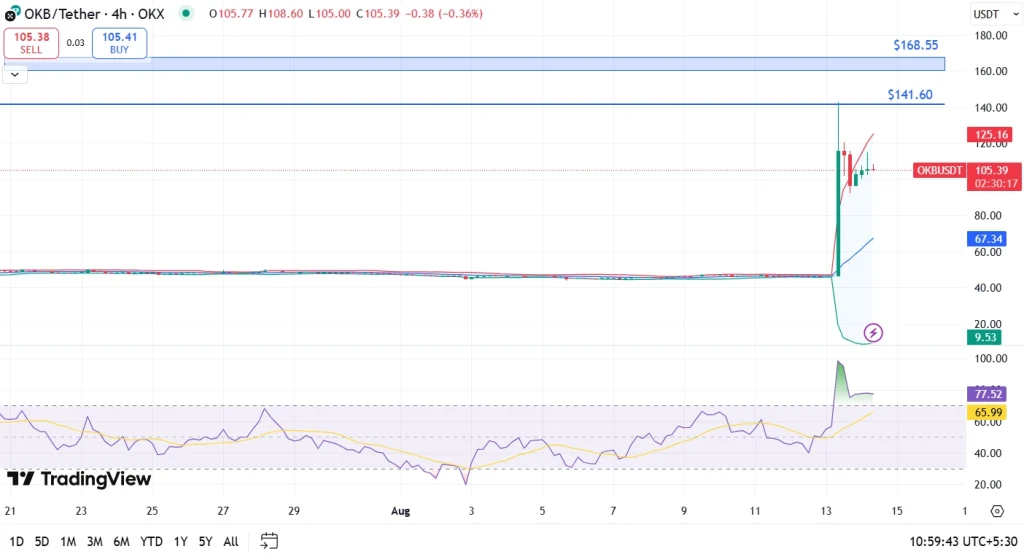
The immediate support to watch lies at $103.35, which aligns with the 38.2% Fibonacci retracement. A decisive move below this level could open the door to a deeper pullback toward $90–$95. On the upside, a recovery above $117 WOULD put $141.60 and $168.55 in focus as the next resistance zones. Short-term traders should monitor these technical levels closely, as rapid price swings are likely.
FAQs
1. Why did the OKB price surge so quickly?The rally stems from a massive token burn reducing supply by 52% and the upgraded X Layer blockchain improving utility.
2. Is OKB overbought right now?Yes. The RSI at 94.6 signals extreme overbought conditions, often followed by short-term corrections.
3. What price levels are critical to watch next for OKB?$103.35 is the key support. A MOVE above $117 could open a path to $141.60 and $168.55.
