Hedera (HBAR) Rockets 30% After Robinhood Listing—$0.30 Target In Sight?

Robinhood just handed Hedera a rocket booster. HBAR’s price surged double-digits within hours of the trading app’s listing—now traders are eyeing that $0.30 resistance like a Wall Street bonus.
Why the frenzy? Mainstream access. Robinhood’s 23M users can now tap HBAR with zero commission, a move that screams 'retail liquidity tsunami.' The altcoin’s market cap ballooned faster than a VC’s ego during a bull run.
Technical breakout. HBAR sliced through its 200-day MA like a hot knife through institutional FUD. The RSI’s nudging 70—overbought? Sure. But since when did crypto care about fundamentals?
Watch the macros. If Bitcoin holds $65K, HBAR’s rally could turn into a full-blown altseason parade. Just don’t mention the SEC’s ongoing 'how to regulate this' existential crisis.
Closer: Whether this pumps to $0.30 or dumps on Robinhood’s next outage, one truth remains—nothing moons faster than a token that just onboarded the 'I only invest during commercials' crowd.

Hedera has grabbed the spotlight in the crypto market, with a surge of over 12% in the last 24 hours to trade at $0.2666. The spike comes after its listing on Robinhood, which gives it access to over 20 million U.S. retail users. Backed by a robust 58% jump in 24-hour trading volume, now at $1.03 billion, HBAR is regaining strong bullish momentum.
Its pace is further supported by growing ETF speculation and recent network upgrades. With market cap swelling to $11.3 billion, HBAR has clearly entered a high-energy phase. Curious about where the Hedera Price is heading next? This short-term HBAR price analysis is all you need.
HBAR Price Analysis
On the daily chart I’ve shared, HBAR has broken above its previous resistance at $0.26, which very well aligns with the 23.6% Fibonacci retracement level. This came into play after forming a “higher low” at $0.233 on July 24. That being said, traders need to watch out for the immediate support zone, seen between $0.2480–$0.2520, with a more critical stop-loss threshold at $0.2390.
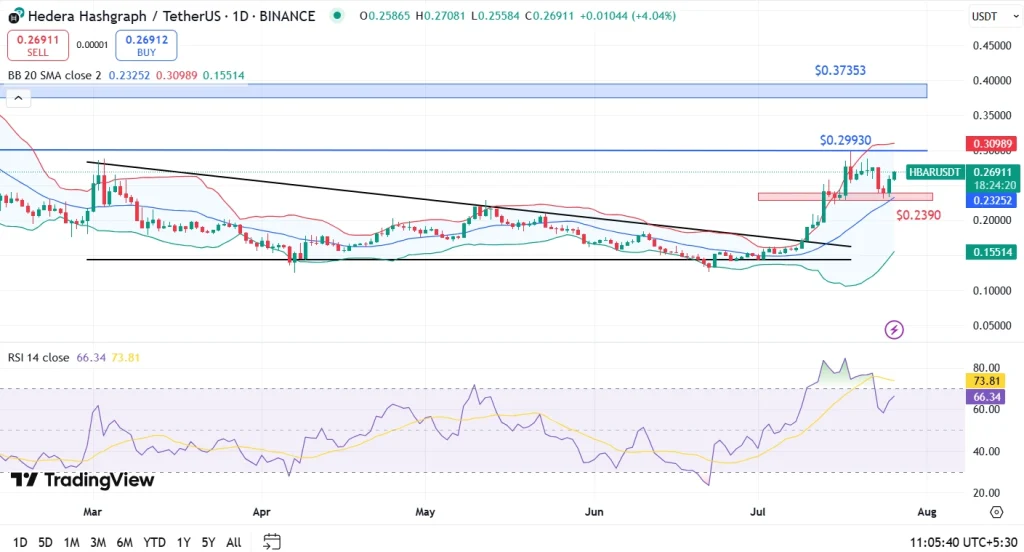
Talking about indicators, the 14-day RSI stands at 66.34, running closely with overbought territory but still suggesting room for upside. Meanwhile, the MACD remains slightly bearish with a negative histogram (-0.00022), though the price has consistently held above its 7-day simple moving average at $0.2611.
If the bullish momentum continues, HBAR price could next target its July 25 high of $0.2976, followed by a potential breakout toward $0.3274. A successful close above $0.2993 would validate this bullish trajectory, with long-term resistance at $0.3735.
FAQs
Why is the HBAR price up today?The price surged after HBAR was listed on Robinhood, increasing accessibility and triggering a 58% rise in trading volume.
What is the next price target for HBAR?The immediate resistance is at $0.29930, followed by $0.3274 and a longer-term cap NEAR $0.3735.
Is the trend bullish for HBAR now?Yes, the trend is bullish. RSI is strong, price has formed a higher low, and it’s trading above short-term SMAs.
