BNB Smashes Through $804 Barrier—Price Discovery Mode Activated! Can $1,200 Be the Next Stop?

Binance Coin isn't asking for permission—it's taking names. After breaching the $804 resistance like a hot knife through butter, BNB has officially entered uncharted territory. No historical data, no ceiling, just pure upside potential.
The FOMO Engine Is Running Hot
Traders are piling in as the token defies gravity. With zero overhead resistance, technical analysts are dusting off their 'moon' memes. The last time markets saw this kind of momentum, Tesla stock was still a Wall Street darling.
$1,200 or Bust?
Fibonacci extensions suggest the next psychological target sits at $1,200—a 50% surge from current levels. Of course, in crypto-land, 'suggest' means 'absolutely guaranteed' until it isn't. Just ask the 'stablecoin' investors from 2022.
Binance's ecosystem growth fuels the fire: exchange dominance, smart chain adoption, and that sweet, sweet burn mechanism. Meanwhile, traditional finance still can't decide if crypto is a scam or their next revenue stream.
One thing's certain—when price discovery kicks in, either portfolios get richer or bagholders get creative with their loss porn. Place your bets.

Binance Coin (BNB) price has officially entered uncharted territory after smashing through its previous all-time high (ATH) and hitting $804. As one of the most prominent altcoins in the crypto space, this breakout has attracted massive interest from traders and analysts alike. Now, with bullish momentum accelerating, all eyes are on the next key levels—namely $950, $1,000, and $1,200, as suggested by various technical indicators.
BNB Price Analysis: Breaking the $804 Barrier
BNB’s breakout above its 2021 ATH at ~$690 marks a major technical milestone. The rally has been supported by increasing volume and momentum indicators that continue to trend higher. As the coin moves into price discovery mode, traders are turning to Fibonacci extensions and trend-based models to forecast potential upside targets.
The surge to $804 occurred after a clear breakout from an ascending triangle, a bullish continuation pattern that typically signals further gains. The triangle breakout measured move suggests a price target NEAR $1,000, aligning with psychological resistance and Fibonacci projections. However, the RSI is incremental, which is yet to enter the overbought zone, suggesting the price is due for another breakout soon.
Technical Indicators Supporting BNB’s Rally
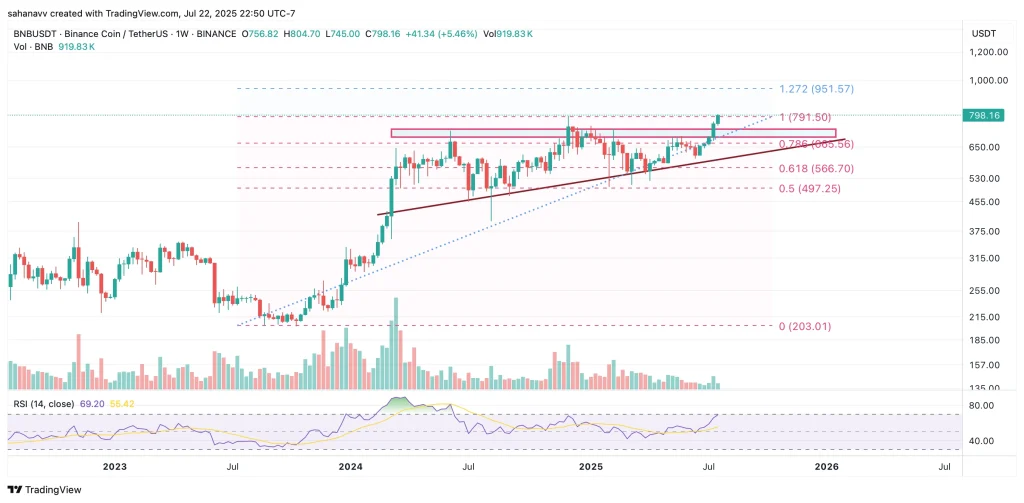
Fibonacci Extension LevelsDrawing from the swing low at ~$180 (June 2022) to the $690 high:
- 0.618 Fib Extension = $804 (already tested and briefly breached)
- 1.0 Extension = $950 (next short-term target)
- 1.618 Extension = $1,200 (longer-term, overbought rally target)
These Fibonacci zones are common profit-taking areas during extended bull runs and act as soft resistance.
Relative Strength Index (RSI)- Current RSI is above 80, indicating an overbought zone.
- However, during parabolic rallies, RSI can remain overbought for weeks before any correction.
- No signs of divergence yet—momentum remains intact.
- Strong bullish crossover with expanding histogram.
- MACD line well above the signal line—classic sign of strength.
- Supports continued upward movement with minimal short-term bearish pressure.
- Breakouts above $700 and $800 have been supported by above-average volume.
- Order books across exchanges show thinning resistance until the $950–$1,000 zone.
BNB Price Targets: What’s Next?
| Target Level | Indicator Basis | Probability |
| $950 | 1.0 Fib Extension | High—short-term target |
| $1,000 | Psychological Resistance | High—could trigger profit booking |
| $1,080 | Bull flag breakout target | Medium—next in rally continuation |
| $1,200 | 1.618 Fib Extension | Moderate—long-term bullish target |
