Bitcoin’s Rollercoaster: Brace for a $97K Dip Before Rocketing to $130K

Bitcoin's price trajectory is setting up for a classic crypto whipsaw—stomach-churning drop first, moonshot after.
The $97K support test
Markets are pricing in a 10-15% correction as overleveraged longs get liquidated. Traders eyeing the $97K level as make-or-break support before any sustained rally.
The $130K endgame
If historical halving cycles hold, this dip could be the last buying opportunity before Bitcoin enters price discovery mode again. Institutional FOMO kicks in hard above $100K.
Meanwhile, Wall Street analysts who called Bitcoin 'worthless' at $20K are suddenly discovering 'blockchain potential'—just in time for their clients' quarterly performance reviews.

Bitcoin is flashing bullish signals once again—and a major breakout could be just around the corner. After posting a solid 29.2% gain in Q2 so far, BTC might be gearing up for its next leg up, according to crypto analysts on X.
Bitcoin Price Performance in Q2 2025
- Q2 Growth: 29.2% so far
- April Return: 14.2%
- May Return: 11.1%
- June Return (so far): 1.90%
In May, Bitcoin climbed from $94,177.90 to touch a monthly high of $111,704 on May 22. But after hitting that peak, BTC retracedbetween May 23 and June 5. A brief rebound of 8.61% followed between June 6 and 10—but the price couldn’t break the previous swing high.
Between June 11 and 22, bitcoin dipped again by 8.46%, only to bounce 1.2% in the last 24 hours—hinting at possible renewed momentum.
Bullish Flag Pattern Forming: Analyst Insight
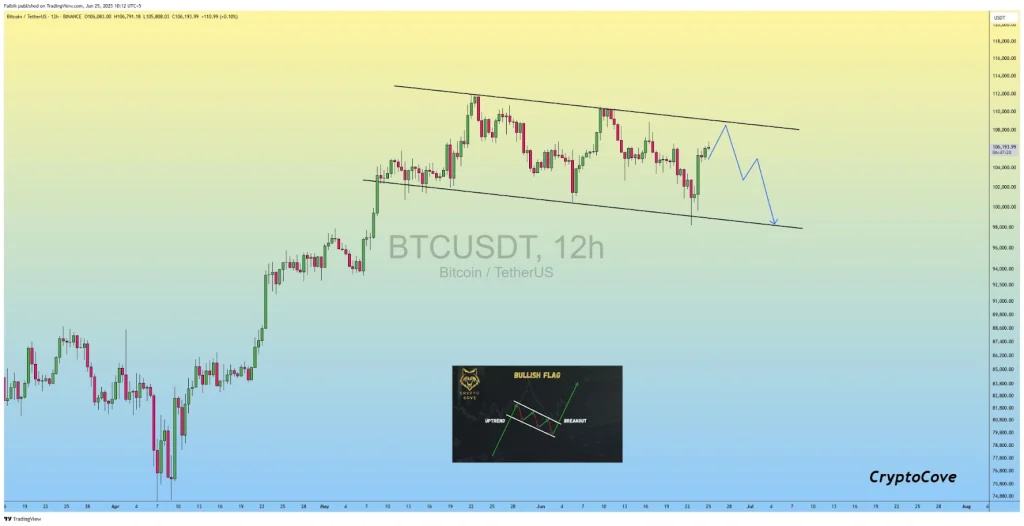
Crypto analyst Caption Faibik, in a recent post on X, revealed that Bitcoin is forming a classic bullish flag pattern—a continuation setup that often signals the next leg of a bull run.
“Before the next surge, BTC may briefly dip to the $97K–$98K range,” says Faibik. “Once it breaks past the $108K resistance, the rally toward $130K is likely.”
Thefeatures:
- A strong upward move (the flagpole)
- A slight downward or sideways consolidation (the flag)
- A breakout above the flag’s upper boundary signals continuation of the trend
Bitcoin’s Key Levels to Watch
- Support Zone: $97,000–$98,000
- Breakout Level: $108,000
- Midterm Target Post-Breakout: $130,000
Experts agree that a strong daily close above $108K will confirm the bullish breakout and could open the doors to the much-anticipated six-figure surge.
BTC Community Reacts: Dip Before the Rocket?
Crypto analyst Chainbull and several BTC enthusiasts echo Faibik’s prediction, believing that the current dip is a healthy consolidation before the next leg up.
If Bitcoin follows the expected pattern, a breakout to $130K could become the dominant narrative going into Q3.The charts suggest Bitcoin isn’t done yet. A short dip could lead to a major breakout—and BTC could be heading to $130K sooner than expected.
Never Miss a Beat in the Crypto World!Stay ahead with breaking news, expert analysis, and real-time updates on the latest trends in Bitcoin, altcoins, DeFi, NFTs, and more.

FAQs
When did Bitcoin reach its all-time high price of nearly $20,000?Bitcoin first reached nearly $20,000 in December 2017. It then surpassed this in later cycles.
When did Bitcoin reach its highest price?Bitcoin has set several all-time highs. Its most recent recorded high was over $111,970 on May 22, 2025. It also crossed $100,000 in December 2024.
What is the Bitcoin price prediction if it breaks out?If Bitcoin breaks decisively above $108,000, analysts predict a rally towards $130,000, confirming the next leg of its bull run based on a bullish flag pattern.

Log in to Reply
Log in to comment your thoughtsComments
Related Articles
|Square
Get the BTCC app to start your crypto journey
Get started today Scan to join our 100M+ users