SUI Nears Breakout Territory: Golden Cross Signals Bullish Momentum—Here’s Where It Could Go Next

Move over, traditional assets—SUI’s chart just flashed a golden cross, and traders are circling like sharks. The technical setup suggests a potential breakout, but where’s the line in the sand?
Key levels to watch: If SUI holds above the 50-day moving average, bulls might push for a retest of the recent high. A dip below? Brace for a showdown at support.
Funny how a single candlestick pattern can make crypto Twitter lose its mind—meanwhile, Wall Street still thinks 'blockchain' is a type of yoga. Stay sharp, watch those levels, and maybe—just maybe—don’t FOMO.

The sui price triggered a strong reversal before the daily close, pushing the levels back within the bullish zone. The token had entered a phase of tightening price action, hinting at a potential breakout or breakdown. In the times when the broader market sentiments remained uncertain, the current reversal presents a compelling case for the bulls. However, a continued upswing above the key ranges could validate a rise to $3.75 or levels above.
Now, the question arises whether the bulls will continue to hold a tight grip over the rally.
The token is demonstrating huge strength as it reversed the bearish pattern of H&S, which was speculated to drag the levels below $2.5. With this, the token continues to demonstrate a potential of a 90% upswing that could elevate the levels towards new highs. Meanwhile, in the short term, the bulls appear poised to push the price above $5 as the token is poised to validate a ‘Golden Cross.’
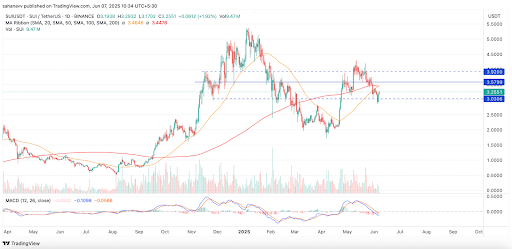
The rebound from the local support hinted towards the growing dominance of the bulls; moreover, the bullish crossover of the 50/200 MAs validated the bullish claim. The previous Golden cross resulted in a 350% rise, which helped the SUI price to form a new ATH around $5.3 and hence a similar price action is expected. Meanwhile, the MACD shows a drop in selling pressure, being within the bullish range, while the other indicators raise some concerns.
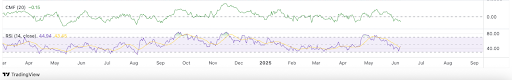
The RSI is hovering around 44.83 and is about to rise above the RSI-based MA. If it rises above the range, it could validate a bullish continuation, while the drop in CMF levels points towards bearish continuation, as it hints towards a decrease in the money FLOW onto the platform. Only if the levels rise back above 0 can a bullish continuation occur. For this, the SUI price is expected to secure the levels above $3.5, which may push the price to $4.
Therefore, the SUI price prediction in the long term is bullish, but the short-term forecast remains shady.
