Bitcoin’s Market Structure Hints at Imminent Parabolic Surge

Bitcoin’s chart setup screams bullish—again. The market’s structural foundations now mirror pre-pump conditions seen in previous cycles, suggesting another leg up is brewing.
Key signals flashing green:
- Higher lows holding since the last correction
- Declining exchange reserves as whales accumulate
- Options markets pricing in volatility expansion
Wall Street analysts (who still can’t agree whether crypto is ’digital gold’ or a ’risk asset’) are quietly repositioning. Meanwhile, retail traders remain distracted by the latest memecoin casino—classic.
One thing’s clear: when Bitcoin’s technicals align like this, fireworks usually follow. Whether it’s another 2x or a grind toward new ATHs, the path of least resistance points north.
- A weakening U.S. dollar amid rising crypto optimism has favored bullish sentiments for Bitcoin in the short term.
- The ongoing cooling down of the leveraged crypto trading has set a precedent for a fresh rally beyond $111.9k.
The rising conflict between the United States and the European Union has weighed down on a weakening greenback against major global currencies. The cryptocurrency market, led by Bitcoin (BTC), has emerged as a better alternative for investors seeking to hedge against macroeconomic uncertainties.
Since the Doland Trump administration took office earlier in 2025, three states – including New Hampshire, Arizona, and Texas – have approved the strategic Bitcoin reserve bills in both the senate and House. In the past six days, Bitcoin’s investment products recorded a net cash inflow of about $2.3 billion, according to market data from CoinShares.
With the CME futures and options markets leaning towards bullish sentiment, BTC price will soon enter the euphoric phase of the 2025 crypto bull run.
Bitcoin Price Expectations in the Midterm
In the 1-hour timeframe, BTC price has been rising in a parallel channel since a local low of about $74.8k earlier in April. Earlier this week, BTC price was rejected at the upper border of the rising channel and is now signaling a drop towards the lower border.
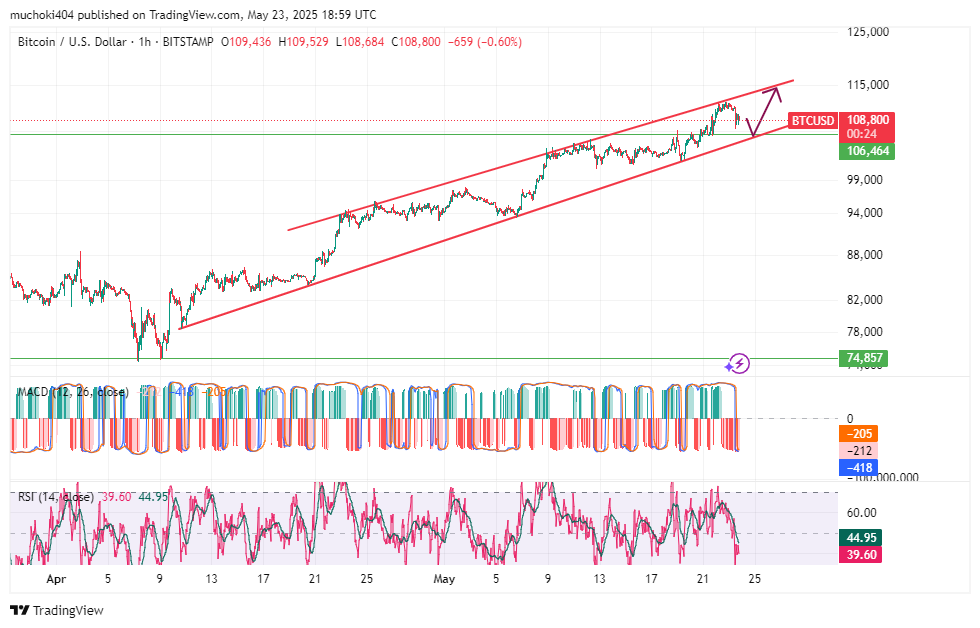
Moreover, the 1-Hour MACD line has already dropped below the zero line and the histograms have been growing in a bearish fashion in the past two days.
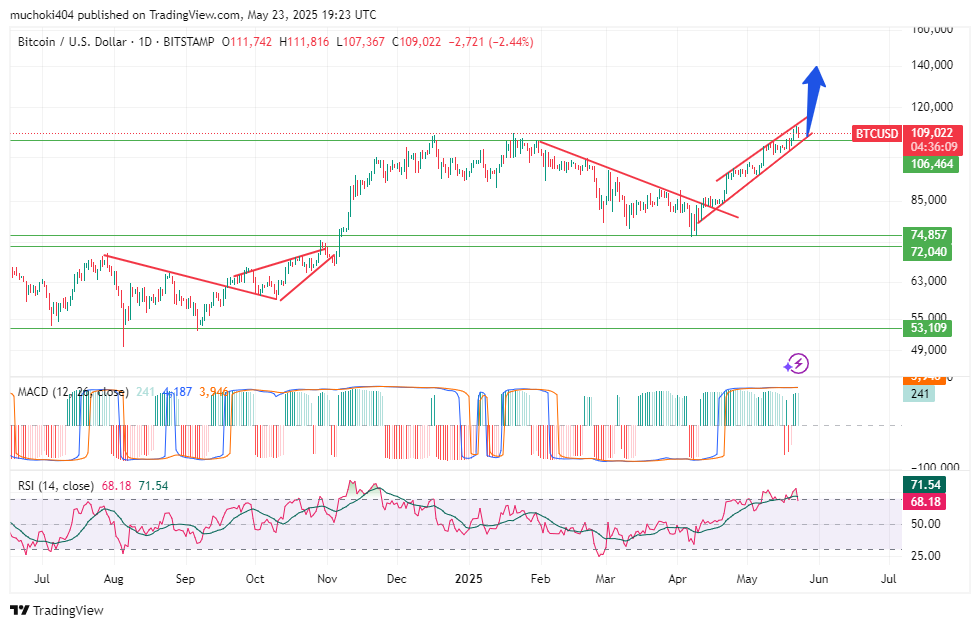
In the daily timeframe, BTC price has been following an almost similar fractal pattern to the Q4 2024 bullish breakout. If BTC price consistently closes above the upper border of the established rising channel in the coming days, a potential rally towards $140k will be inevitable. However, a consistent close below the lower border of the rising channel will trigger a rejuvenated bearish pressure potentially towards $74k again.
