Liquidity Pools Swell Near $100K Bitcoin and $3,500 Ethereum—Will Prices Finally Break Through?

Massive liquidity clusters are forming around key psychological price levels for the two crypto giants. It's a classic standoff between accumulation and distribution.
The Liquidity Magnet
Markets don't move without fuel. Right now, the order books are thickening around Bitcoin's $100,000 milestone and Ethereum's $3,500 zone. This isn't random noise—it's institutional and algorithmic players placing their bets, creating a gravitational pull that prices can't ignore for long. Think of it as a high-stakes game of chicken between buyers and sellers.
The Breakout Equation
Reaching a price zone and holding it are two different beasts. All that liquidity acts as both a launchpad and a trap door. A clean break above these levels with sustained volume could trigger a classic short squeeze, sending prices into uncharted territory. Fail to hold, and that same liquidity becomes a selling cascade—a reminder that in crypto, support is just resistance you haven't met yet.
So, will they reach the zone? The tape says they're already knocking. The real question is what happens when the door finally opens. After all, on Wall Street, 'liquidity' is just a polite word for 'greater fool theory' with better marketing.

After months of consolidation, the top two cryptos seem to be experiencing a strong breakout in the coming days. Bitcoin and Ethereum are moving closer to price levels that could trigger a sharp shift in market behaviour. The latest liquidation data suggests, the future traders have set a strong resistance wall, slightly higher than the current range. Hence, if the BTC price and ETH price manage to break above the range, they both may eventually reclaim and surge above previous highs.
Bitcoin Liquidation Map: Why $100,000 Is a Volatility Trigger
The liquidation map for bitcoin shows a heavy concentration of short liquidation leverage stacked above the current price, with a major cluster forming just below and around $95,000. Moreover, the cumulative short liquidation leverage has surged above $5 billion at $100,000 and above.
This means many traders are positioned against further upside. If Bitcoin starts moving higher with momentum, those short positions can be forced to close automatically. Each forced close becomes a market buy, which can push the price even higher, called a short squeeze. If Bitcoin breaks above nearby resistance and enters this liquidity zone, the price could move quickly, not gradually.
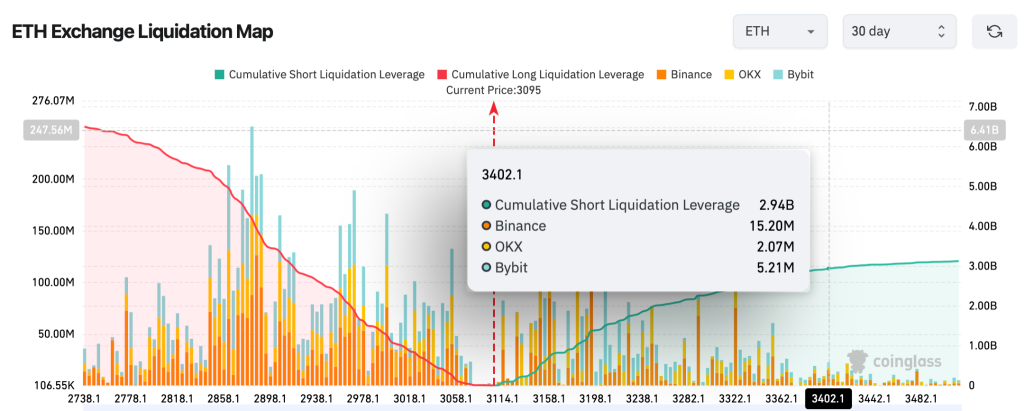
$3B Ethereum Shorts Accumulate Around $3400
The Ethereum setup also looks very similar to Bitcoin. The traders have piled up billions in shorts, which is believed to have become a major threshold. If these liquidation zones are hit, the ETH price may eventually break the cluster at $3400 or $3500 and rise above $4000. The only thing that differentiates Ethereum from Bitcoin is that it reacts faster than the BTC price once the liquidation zones are hit.
The liquidation map for ethereum shows a dense short-side cluster building from $3,400, with more than $3 billion in potential liquidations stacked above the range. If ETH pushes into this zone, forced liquidations could trigger a fast upside expansion. That makes $3,500 a key level not just for ETH traders but for the broader altcoin market.
The Bottom Line
$100,000 for Bitcoin and $3,500 for Ethereum are not price targets—they are pressure points.
If price is pushed into these zones, forced liquidations could turn a steady MOVE into a fast, momentum-driven surge, with volatility spilling across the entire market. These are the moments when trends accelerate, and positions get tested quickly. But if momentum fades before those levels are reached, the stacked liquidity remains untouched, and the market may continue to grind sideways longer than most expect.
