Bitcoin’s Historic Compression Meets Macro Tailwinds: The High-Timeframe Breakout Is Coming

Bitcoin coils tighter than a spring. The macro backdrop? It's shifting in its favor. Forget the daily noise—this is about the long game.
The Squeeze Before the Leap
Volatility has flatlined. Price action compresses into a narrowing band, a classic sign of energy building before a major directional move. It's not boredom; it's potential, stored and waiting. Markets hate a vacuum, and this one's about to be filled.
Macro Winds Changing Direction
Outside the crypto charts, the old financial world staggers. Rate hike cycles show fatigue. Institutional eyes, once skeptical, now scan for hedges against traditional system fragility. Capital looks for an exit—and a familiar, decentralized door is standing open.
Why This Time Is Different
Past cycles had their catalysts. This one has maturity. The network's stronger. The players are bigger. The narrative has evolved from digital cash to a hard asset in a world drowning in soft currency—a favorite talking point at Davos, right before another round of quantitative easing is proposed.
The stage is set. The pressure's built. When a market sits this quiet for this long against a backdrop this loud, it doesn't whisper its next move. It screams it. Get ready for the breakout.

After the latest drop, Bitcoin price consolidates around $87,000, within a narrow range that is now pressing against multi-week resistance. The star token usually accumulates before undergoing the next price action, and hence, the ongoing price compression is believed to transform into a gigantic breakout. While the macro narrative has soured and unemployment is rising, with liquidity expectations shifting, several high-timeframe technical signals are tightening. Historically, this type of macro-technical overlap has preceded a decisive BTC breakout.
BTC Price Consolidating Within a Critical Zone
The BTC price lost the pivotal support zone around $88,600 during the recent pullback and has been compressing below the key resistance since then. The price is forming a sequence of higher lows below the range of $87,500 and $88,300, while volatility bleeds out. This type of squeeze historically revolves in the direction of the primary trend, still firmly upward.
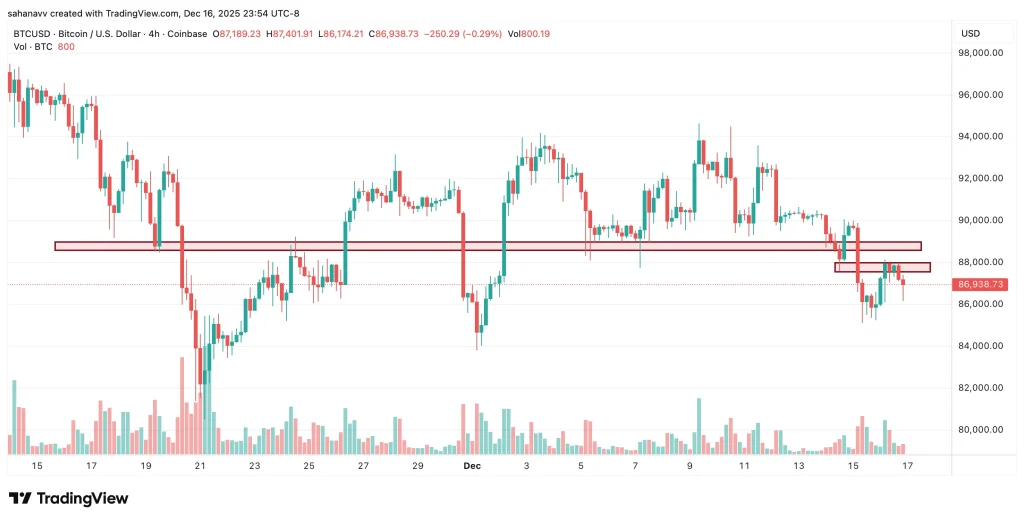
Observing the above chart, it WOULD be clear that breaking the newly formed resistance zone between $87,500 and $88,000 is essential to open the doors beyond $90,000. However, it could further test yet another important barrier at $89,000, which has been a strong trend reversal zone since the start of the month. Therefore, a close above $88,500 to $89,000 would open the path to $90,000 to $92,000 based on previous liquidity pockets and untested price inefficiencies.
On-Chain Positioning Points Toward Accumulation, Not Exhaustion
On-chain data continues to signal strength beneath Bitcoin’s price action. While BTC trades just below major resistance, wallet behaviour, long-term holder supply, and derivative positioning all indicate steady accumulation rather than distribution. Futures open interest is elevated around ~$60 billion (not collapsing), while funding rates remain neutral—suggesting traders aren’t panicking out of longs.
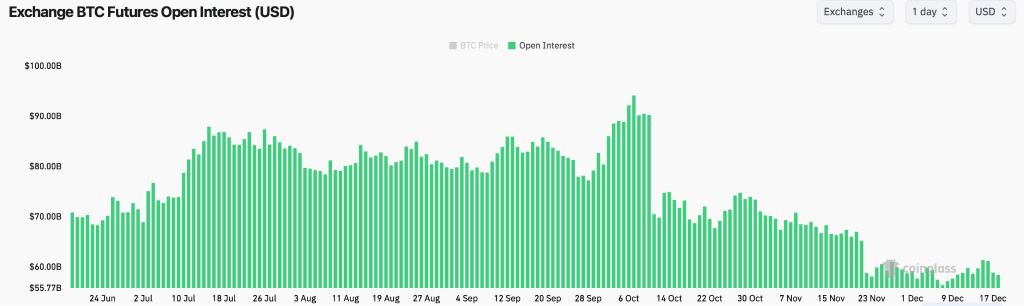
Bitcoin’s futures open interest has stayed elevated rather than crashing, indicating steady engagement rather than forced deleveraging—a common sign of capitulation. Funding rates have hovered NEAR neutral, reflecting balanced leverage rather than extreme short-term blow-offs. Collectively, this pattern aligns with accumulation behaviour on-chain, not exhaustion.
The Bottom Line-What’s Next for the Bitcoin Price Rally?
Bitcoin’s tightening price structure is forming against a macro backdrop that is quietly becoming more supportive. Rising unemployment has historically increased expectations of liquidity support, and while policy shifts are not immediate, risk assets tend to MOVE ahead of them. Importantly, this is occurring while leverage remains controlled, ETF flows have stabilised, and on-chain data shows little evidence of broad distribution.
From here, the market has two clear paths. A decisive break above $88,300 would likely trigger a liquidity-driven expansion toward $90,000–$92,000, confirming that the current compression has resolved higher. A rejection, on the other hand, could sweep support near $85,600, but unless $84,300 breaks on a daily close, such a move would resemble a reset rather than a trend reversal.
