Ethereum Price Gears Up for a Breakout—Can ETH Outperform BTC Into the Year-End?

Ethereum's chart is coiled for a major move. The question on every trader's mind isn't just if it will break out, but whether it can finally steal Bitcoin's thunder as the year winds down.
Technical Tension Mounts
Key resistance levels are being tested. The consolidation pattern suggests a buildup of energy—the kind that typically precedes a significant directional shift. Volume trends and on-chain metrics hint at accumulation beneath the surface, a classic sign of smart money positioning before a rally.
The Outperformance Debate
Can ETH flip the script on BTC? The argument hinges on more than just price. Ethereum's underlying network activity—its 'digital economy' of DeFi, NFTs, and layer-2 transactions—provides a fundamental thrust that pure store-of-value narratives lack. A breakout here could signal a market rotation, where capital chases utility over dogma.
Catalysts on the Horizon
Protocol upgrades and a maturing ecosystem act as persistent tailwinds. Unlike traditional finance, where a 'strategic review' often means kicking the can down the road, Ethereum's development pipeline delivers tangible, code-based progress. This constant evolution builds a floor of confidence that pure speculative assets can't match.
The Verdict
The setup is there. The momentum is building. While Bitcoin remains the king of narrative, Ethereum is the engine of function. If the breakout hits, it won't just be a price spike—it'll be a statement on what the market truly values as we close the chapter on another volatile year. After all, in crypto, outperformance isn't just about gains; it's about which story the money believes next.

Ethereum is compressing just below a critical resistance band near $3,300–$3,350, even as the broader crypto market remains unsettled by Bitcoin’s choppy price action around $43,000–$44,000. Despite the volatility, the ETH price has defended support near $3,050, forming a tight consolidation range that often precedes larger moves.
With the ETH/BTC pair hovering NEAR its own inflection zone, traders are now asking: is this sustained strength a sign of accumulation—or simply a pause before another rejection? And if a breakout does occur, does $3,500 become the next logical target before the yearly close?
Two Scenarios Traders Are Watching
Bullish Scenario: Breakout Above $3,350 Opens the Door to $3,500A decisive daily close above the $3,300–$3,350 resistance zone, backed by rising volume, WOULD confirm a breakout from Ethereum’s ongoing consolidation. In this scenario, momentum indicators would likely expand, positioning $3,450–$3,500 as the next liquidity target ahead of the yearly close.
Potential micro-catalysts supporting upside:
- ETH/BTC breaking above near-term resistance, signalling rotation from Bitcoin into large-cap alts
- Bitcoin holding above $43,000 without aggressive selling pressure
- Renewed inflows into ETH-related derivatives, pointing to directional positioning rather than hedging
If these align, ethereum could shift from a range-bound trade into a short-term trend, increasing the odds of temporary outperformance against Bitcoin.
Bearish or Sluggish Scenario: Rejection Near Resistance Keeps ETH Range-BoundFailure to reclaim $3,350 — especially if followed by long upper wicks or declining volume—would indicate persistent sell pressure. In this case, Ethereum risks slipping back toward $3,100–$3,050, reinforcing the broader range rather than triggering a breakdown.
Catalysts that could stall or weaken momentum:
- ETH/BTC failing to clear resistance, keeping Bitcoin as the market’s primary capital sink
- Bitcoin rejection near $44,000, dragging risk sentiment lower
- Declining spot volume, suggesting a lack of conviction from buyers
Under this scenario, ETH may continue consolidating into the year-end, offering limited directional opportunities while traders await a clearer macro or liquidity-driven trigger.
What’s Next: How Will ETH Price Trade by the End of 2025?
Ethereum price is once again at a critical juncture, consolidating near $3,120 as volatility compresses across higher time frames. Despite repeated rejections from the $4,300–$4,600 supply zone, ETH continues to print higher lows, forming an ascending triangle structure. With price currently pinned between the 50-day moving average near $3,300 and the 200-day average around $2,600, traders are watching closely. A decisive break on either side could define Ethereum’s next major narrative ahead of the yearly close.
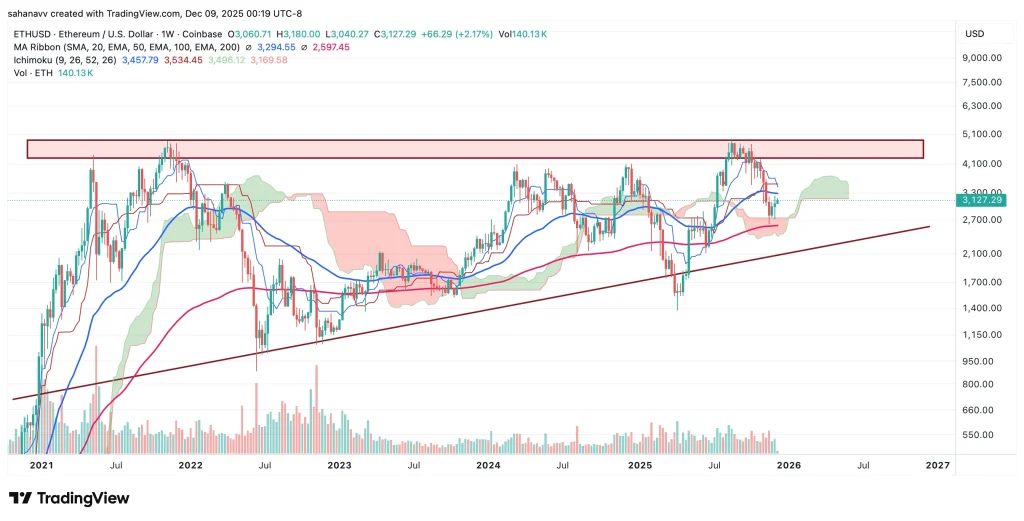
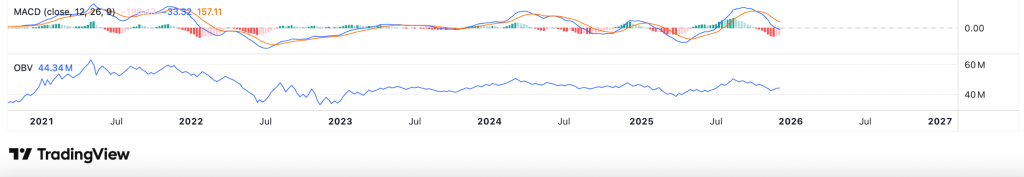
Ethereum’s weekly structure remains constructive as price coils within an ascending triangle, supported by higher lows. ETH is currently trapped between the 50-day MA near $3,300 acting as resistance and the 200-day MA around $2,600 serving as strong support, keeping volatility compressed. The Ichimoku Cloud is beginning to flatten and thin, a setup that often precedes directional expansion. Notably, OBV has printed a bullish divergence, signalling steady accumulation, while the MACD histogram shows a clear reduction in selling pressure. A confirmed break above $3,300 could open the path toward $3,500 and $4,100, while a loss of $2,600 risks a pullback toward $2,300–$2,400.
