Bitcoin Price Analysis Today—Will BTC Hold the Crucial $98,000 Support?

Bitcoin teeters at the edge—$98,000 support becomes the ultimate battleground for bulls and bears.
Technical Breakdown
BTC faces its most critical test since the last major correction. The $98,000 level isn't just another number—it's the line in the sand that separates continued momentum from potential capitulation. Trading volume patterns suggest institutional players are positioning for volatility.
Market Sentiment Check
Fear and greed oscillate like a pendulum as leveraged positions stack on both sides. Retail traders chase the dream while whales play chess with nine-figure stacks. The usual suspects—macroeconomic pressures, regulatory whispers, and Elon Musk tweets—hover in the background like uninvited party guests.
Support Structure Analysis
Multiple timeframes converge at this psychological barrier. Weekly charts show strong historical buying interest, while hourly candles reveal skittish hands ready to fold. The 50-day moving average looms below as backup reinforcement.
Breaking $98,000 could trigger cascading liquidations worth billions—because nothing says 'healthy market' like watching leveraged degens get vaporized in real-time.

The crypto market correction deepens as Bitcoin price slips below the psychological barrier at $100K, marking a 4-month low. Although the price recovered above $102,000, the developing selling pressure is again pushing the levels lower, marking one of the weakest intraday performances in weeks. The ongoing sell pressure floors a sharp correction across the broader crypto market, leaving traders on edge about whether BTC can stabalise above this key psychological level.
While volatility remains high, market participants are closely watching the $98,000 support—a decisive bounce here could determine if Bitcoin avoids a deeper retracement toward the mid-$90,000 range.
The decline comes at a time when U.S. dollar liquidity is tightening, reducing risk appetite across financial markets. This contraction in liquidity—a trend that has historically moved in tandem with Bitcoin’s performance—is adding macro pressure on the crypto market.
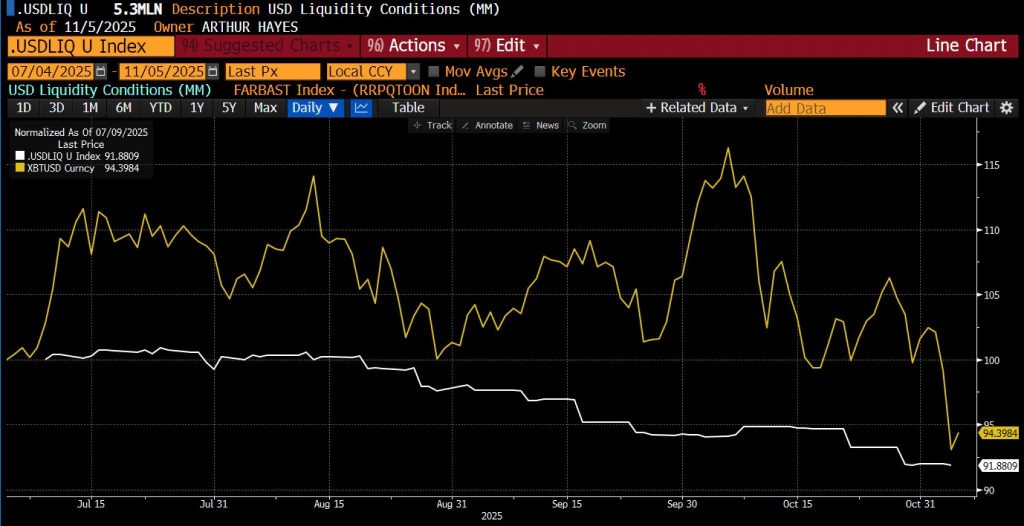
The chart shows the USD Liquidity Index (white line) trending sharply lower through October and early November, reflecting a tighter flow of dollars in the financial system. Historically, bitcoin (yellow line) has moved in tandem with liquidity shifts, strengthening during expansionary phases and weakening when liquidity contracts.
This parallel drop suggests Bitcoin’s current weakness is not purely technical but heavily macro-driven. As liquidity conditions tighten, risk appetite across markets fades, often leading to sustained corrections in assets like BTC. Unless liquidity metrics stabilize or reverse upward, Bitcoin could struggle to sustain recovery rallies above $98,000, leaving the market vulnerable to further downside pressure in the short term.
Will the BTC Price Make it Above $105K or Break it Below $100K?
The BTC price correction deepens with the sellers booking profit, with panic selling reaching its peak. The token, which was already stuck within a descending parallel channel, was about to break the support. However, the bulls managed to defend the support, while the lower target around $98,000 remains activated.
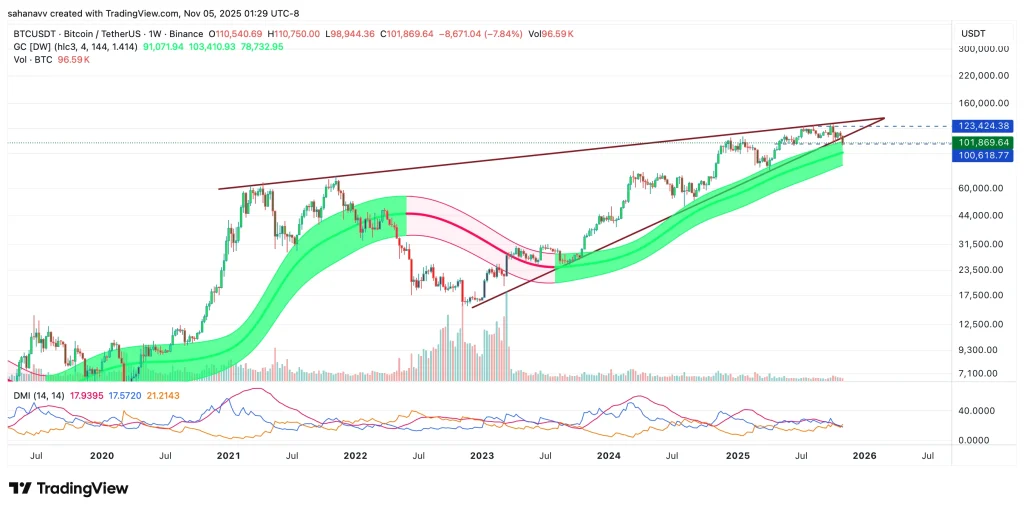
The weekly Bitcoin chart shows the price consolidating within a long-term rising wedge pattern, with the upper boundary acting as resistance NEAR $123,000 and the lower trendline offering support around $98,000–$100,000. The latest pullback has pushed BTC below the midline of the wedge, indicating fading bullish momentum. The green zone, representing a long-term moving average band, still provides dynamic support, suggesting that the broader uptrend remains intact despite short-term weakness.
Meanwhile, the Directional Movement Index (DMI) reflects narrowing momentum, hinting that a decisive breakout—either above $123,000 or below $98,000 — could set Bitcoin’s next major trend direction.
