Inverse Cramer Crypto Signal Flashes: Is a Major Market Crash Imminent Now?

A stark warning emerged across cryptocurrency markets Friday as the 'Inverse Cramer' indicator triggered, signaling potential for a sharp 10% correction. The total crypto market cap fell 0.87% to $2.41 trillion, intensifying fears of a broader sell-off following optimistic television commentary from financial personality Jim Cramer, whose bullish calls have historically preceded market downturns according to the contrarian trading theory.
Global Conflict and the Oil Price Spike
The main reason for this "risk-off" move started far away from the blockchain. On March 13, 2026, the U.S. carried out heavy bombing raids on Iran's Kharg Island. Because this island is a major hub for oil exports, the news caused oil prices to jump immediately. This sparked fears of "stagflation" a scary word for when prices go up but the economy doesn't grow.
Interestingly, Digital assets industry is currently moving in lockstep with the regular stock market. Data shows an 85% correlation between Bitcoin and the S&P 500. This means that when investors get scared about war or expensive gas, they sell their stocks and their digital currency at the same time.
It became a hot topic because just as these tensions peaked, Jim Cramer was telling people the market was "oversold" and it was time to buy.

Source: X (formerly Twitter)
The $165 Million Liquidation Waterfall
When prices start to dip, a "cascade" effect often happens in the digital currency world. Many traders use "leverage," which is like a loan to bet on higher prices. When the market dropped due to the Middle East news, it triggered a wave of forced sales. Bitcoin liquidations shot up by 68%, totaling a massive $165.10M in just 24 hours.
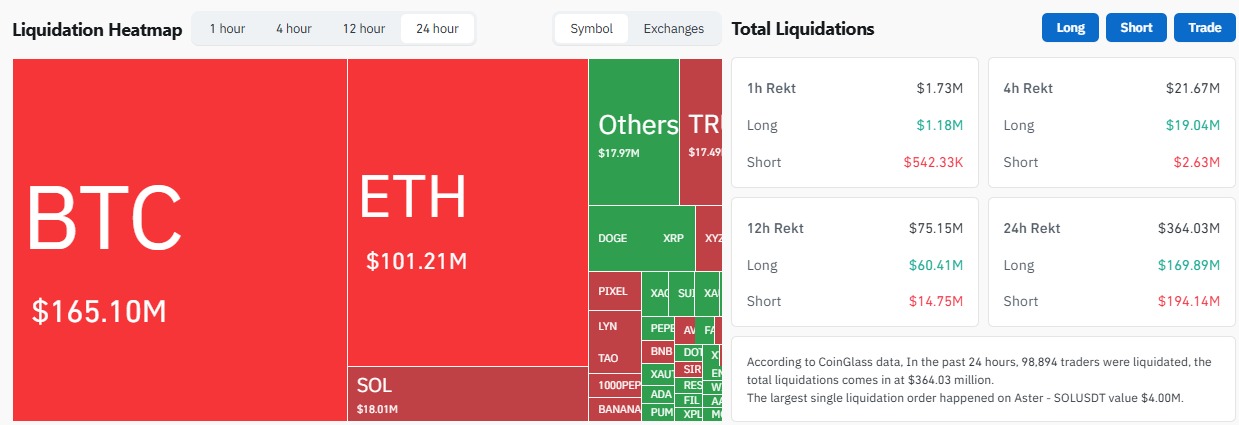
Source: Coinglass Chart
This forced selling created more downward pressure. Even though big institutional investors put $180.4M into Bitcoin ETFs on March 13, it wasn't enough to stop the slide. This confirms that the inverse cramer crypto signal isn't just a meme; it represents the moment when retail optimism meets a harsh reality check from global events.
What Happens Next for Your Portfolio?
The next few days are critical. Experts are watching a specific price level: $2.4T. This is a "Fibonacci support" level, which acts like a floor for the market. If we stay above this floor, things might calm down. If we break below it, we might see the market test a lower floor at $2.33T.
Everyone is now waiting for the Federal Reserve meeting on March 17-18. The Fed will decide what to do with interest rates now that oil prices are causing inflation to rise again. Until then, the inverse cramer crypto signal suggests that being cautious might be the smartest move for your money.
Conclusion
The crypto market is currently being pushed around by big global events rather than its own technology. Between the Kharg Island strikes and the massive liquidation of long positions, the path forward looks bumpy. Keep a close eye on the $2.4T support level and the upcoming Fed announcement to see if the inverse cramer crypto signal continues to play out.
The high correlation with the S&P 500 proves that crypto is not yet a "safe haven" from war. This signal works because it often highlights when retail sentiment is too disconnected from macro risks like energy inflation.
