3 Key Catalysts Fueling Bitcoin’s Sprint Toward $120K

Bitcoin's momentum accelerates as institutional adoption hits unprecedented levels—traditional finance scrambles to catch up while crypto natives stack gains.
Institutional FOMO Reaches Fever Pitch
Wall Street's latecomers flood gates with ETF inflows shattering records weekly. BlackRock and Fidelity's products now trade at volumes that dwarf most legacy financial instruments.
Technical Breakout Confirms Bull Run
The $120K target gains mathematical validity as BTC smashes through multiple resistance levels without retracement. Chart analysts point to clean exponential moving average separations and declining exchange reserves.
Macro Tailwinds Ignite Risk Assets
With the Fed's pivot to rate cuts and dollar weakness accelerating, digital gold narrative returns with vengeance. Traditional hedge funds—still trying to price NFTs—suddenly realize crypto's correlation benefits.
Meanwhile, Goldman Sachs continues hosting 'blockchain workshops' while their quant desks secretly front-run client orders. Some things never change—even in revolution.
BTC nearing bull fatigue zone
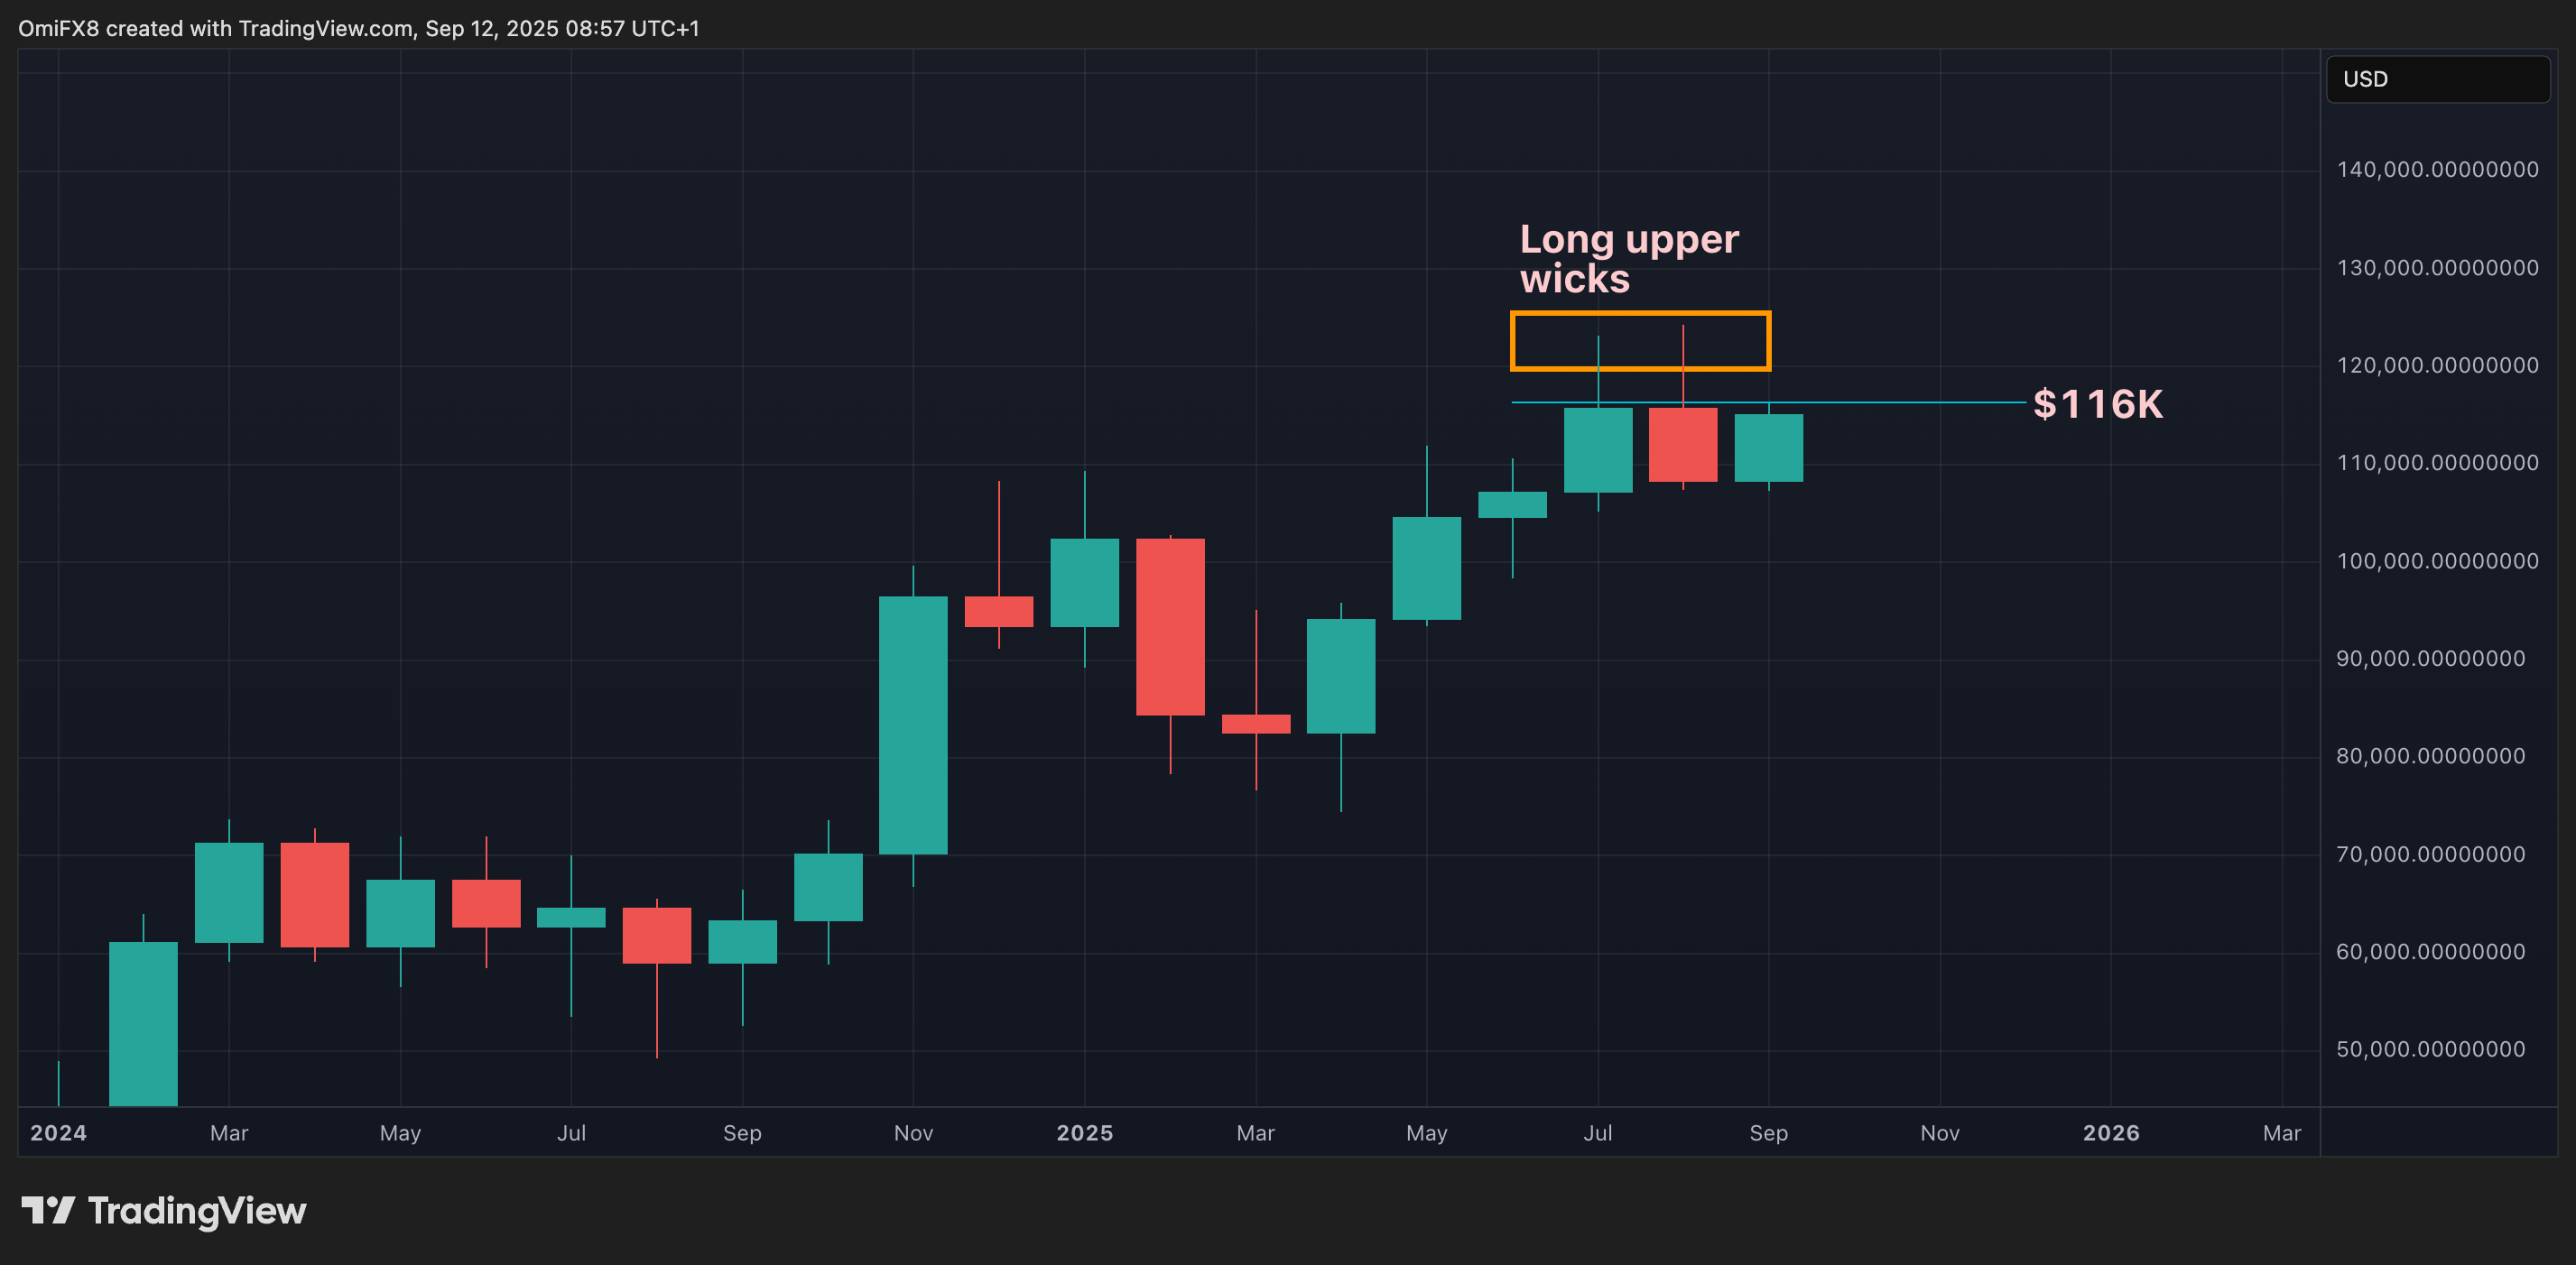
BTC is closing on the bull fatigue zone above $115,000.
While past patterns do not guarantee future results, it is notable that since July, bitcoin’s bull momentum has consistently weakened above the $115,000 level, as reflected by the long upper wicks on the last two monthly candles.
These long wicks indicate that although bulls pushed prices to new record highs above $124,000, strong selling pressure forced the price back below $115,000, signaling a key resistance level and potential hesitation among buyers.
Has the dollar index priced Fed rate cuts?
With the U.S. labor market weakening at a rapid pace, futures traders have priced in 70 basis points (bps) of rate cuts by Dec. 31. That's almost three 25-basis-point rate cuts, starting from Sept. 17. Further, traders have priced in a total of 125 bps of easing by July 2026, which WOULD take the benchmark interest rate down to 3% to 3.25% range from the present 4.25-4.50 range.
Market participants appear confident that the central bank will look past the sticky inflation, as highlighted by Thursday's consumer price index, and cut rates to support the labour market and economic growth. These dovish expectations starkly contrast with those of the Fed's peers, such as the European Central Bank (ECB), which appear to have moved on from rate cuts. In other words, the rate differential favors USD weakness.
Yet, the dollar index, which gauges the greenback's value against major fiat currencies, continues to hover in the recent range of 97.00 to 98.00. The index has dropped just 0.20% to 97.55 this week despite the sharp rise in the Fed rate cut pricing.
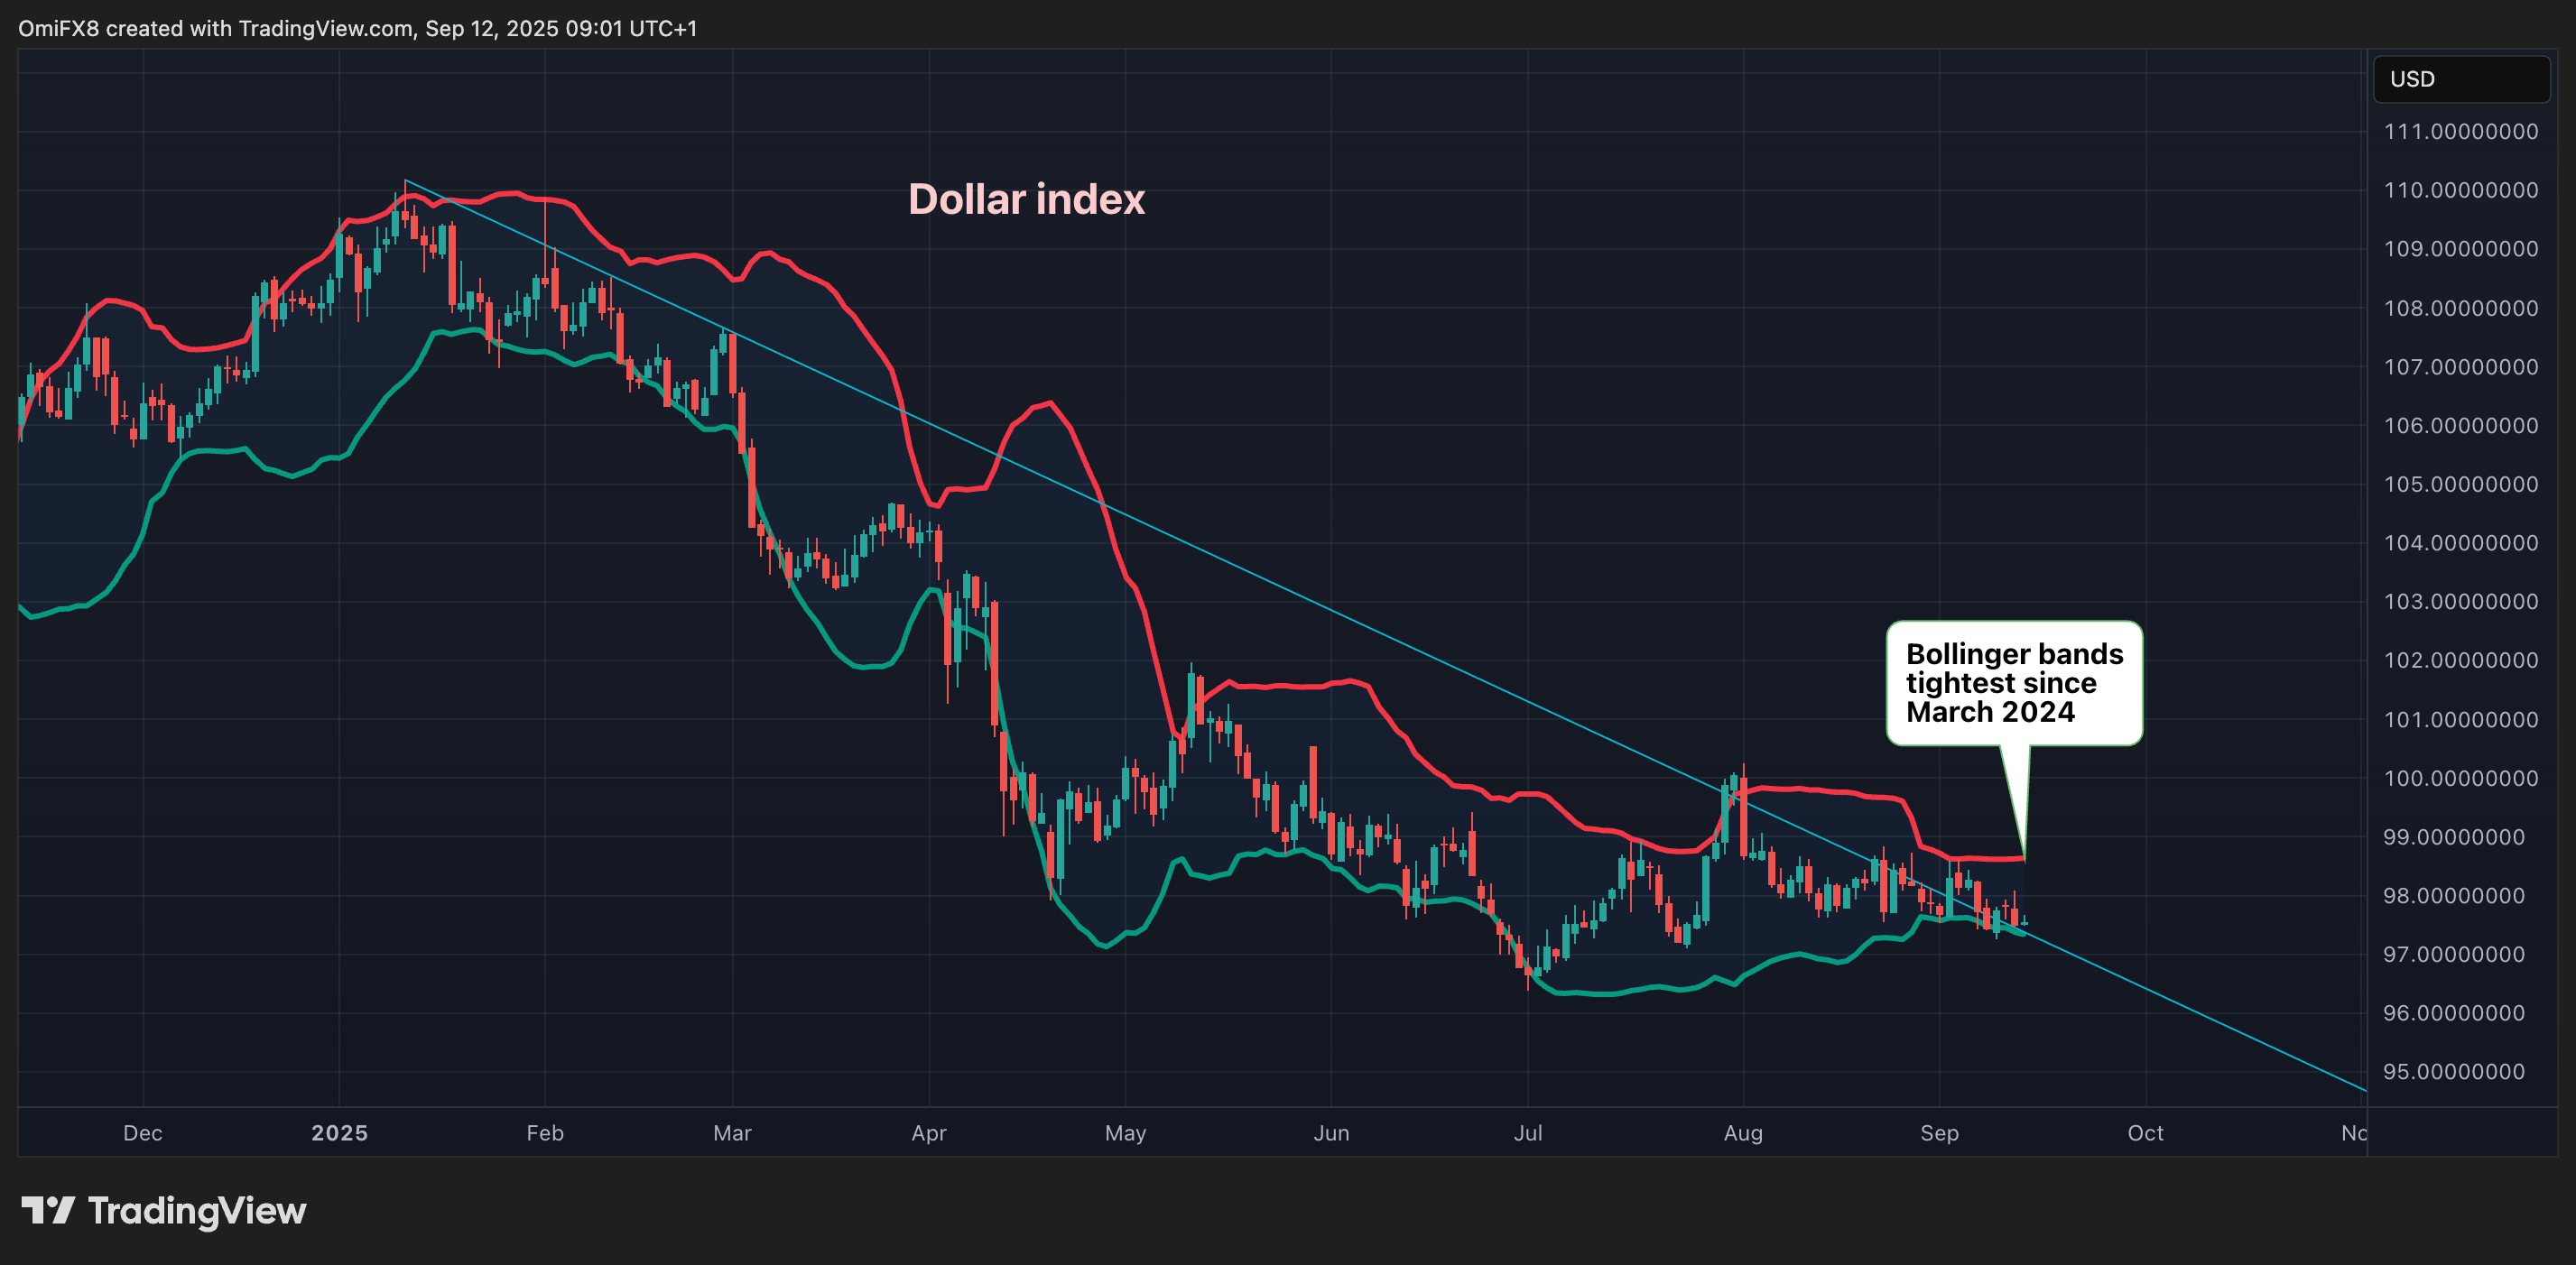
This raises the question: Has the dollar already priced in the Fed rate cuts? If so, it could recover from here, capping gains in the dollar-denominated assets like BTC and gold.
The chart shows that the dollar sell-off has run out of steam since the index hit a low of 96.37 on July 1.
As of writing, the Bollinger bands, or volatility bands placed two standard deviations above and below the index's 20-day SMA, were at their tightest since March 2024. The so-called squeeze means a big MOVE in either direction could happen soon. A bullish one may not bode well for BTC.
Generational bullish shift in 10-year yield
Expectations of rapid Fed rate cuts have fueled anticipation of a sharp decline in the benchmark 10-year Treasury yield, which influences borrowing costs for consumers, businesses, and governments alike. Hence, a slide in the 10-year yield would likely lead to greater risk-taking across both the economy and financial markets.
However, longer-term monthly charts indicate a generational bullish shift in momentum for yields, suggesting that the downside could be limited. So, the anticipated flood of money into riskier assets driven by expectations of ultra-low rates may not materialize. In other words, ultra-low interest rates are unlikely to return anytime soon, which should keep fixed-income instruments attractive to investors.
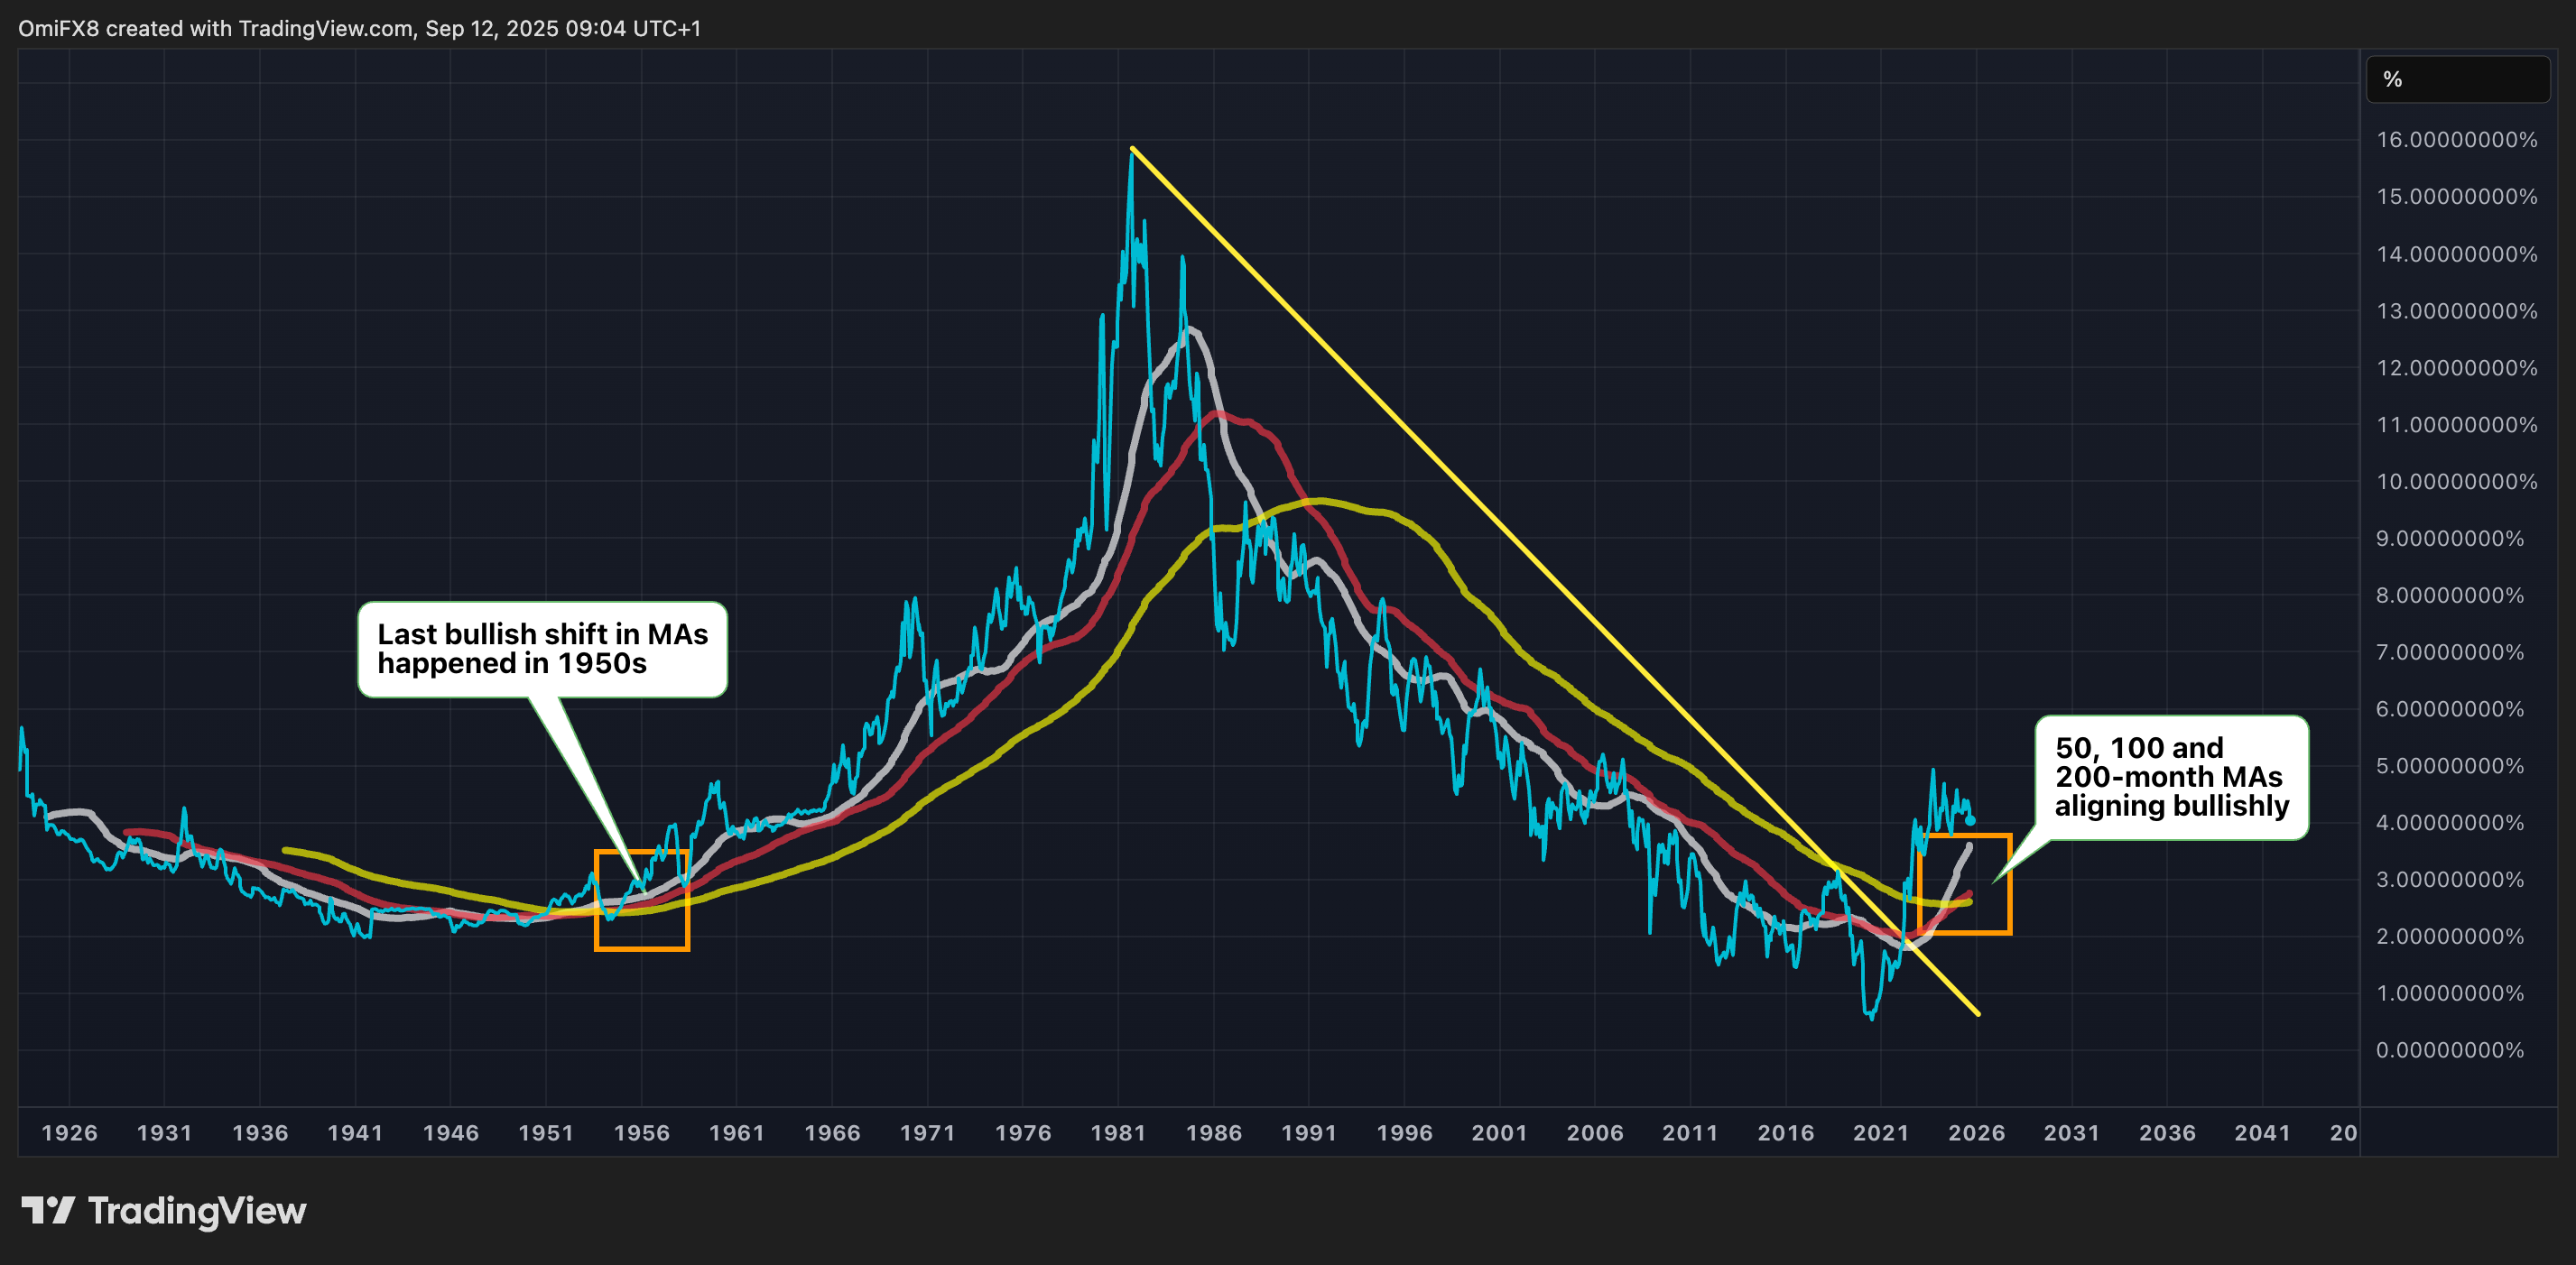
The 10-year yield has surged in the aftermath of the coronavirus pandemic, ending a four-decade-long downtrend that began in 1981.
Furthermore, the 50, 100-, and 200-month MAs have realigned bullishly one above the other. Such a bullish configuration last occurred in the 1950s, marking the onset of a three-decade rally in the benchmark yield.
The same thing can be said for the two-year yield, which tends to be more sensitive to interest rate expectations.
