BTC Targets $120K as Bullish H&S Pattern Emerges: Technical Analysis Breakdown

Bitcoin's chart flashes a classic bullish reversal signal—and it's pointing toward six figures.
The Head and Shoulders Bottom pattern completes as BTC breaks neckline resistance, setting the stage for a potential run toward $120,000. Technical analysts track the measured move target derived from the pattern's depth, while momentum indicators confirm strengthening buyer participation.
Traders watch for sustained closes above former resistance-turned-support—because in crypto, technical patterns sometimes work until they don't, and then everyone blames the Fed. Price action now holds the keys to the next major leg up.
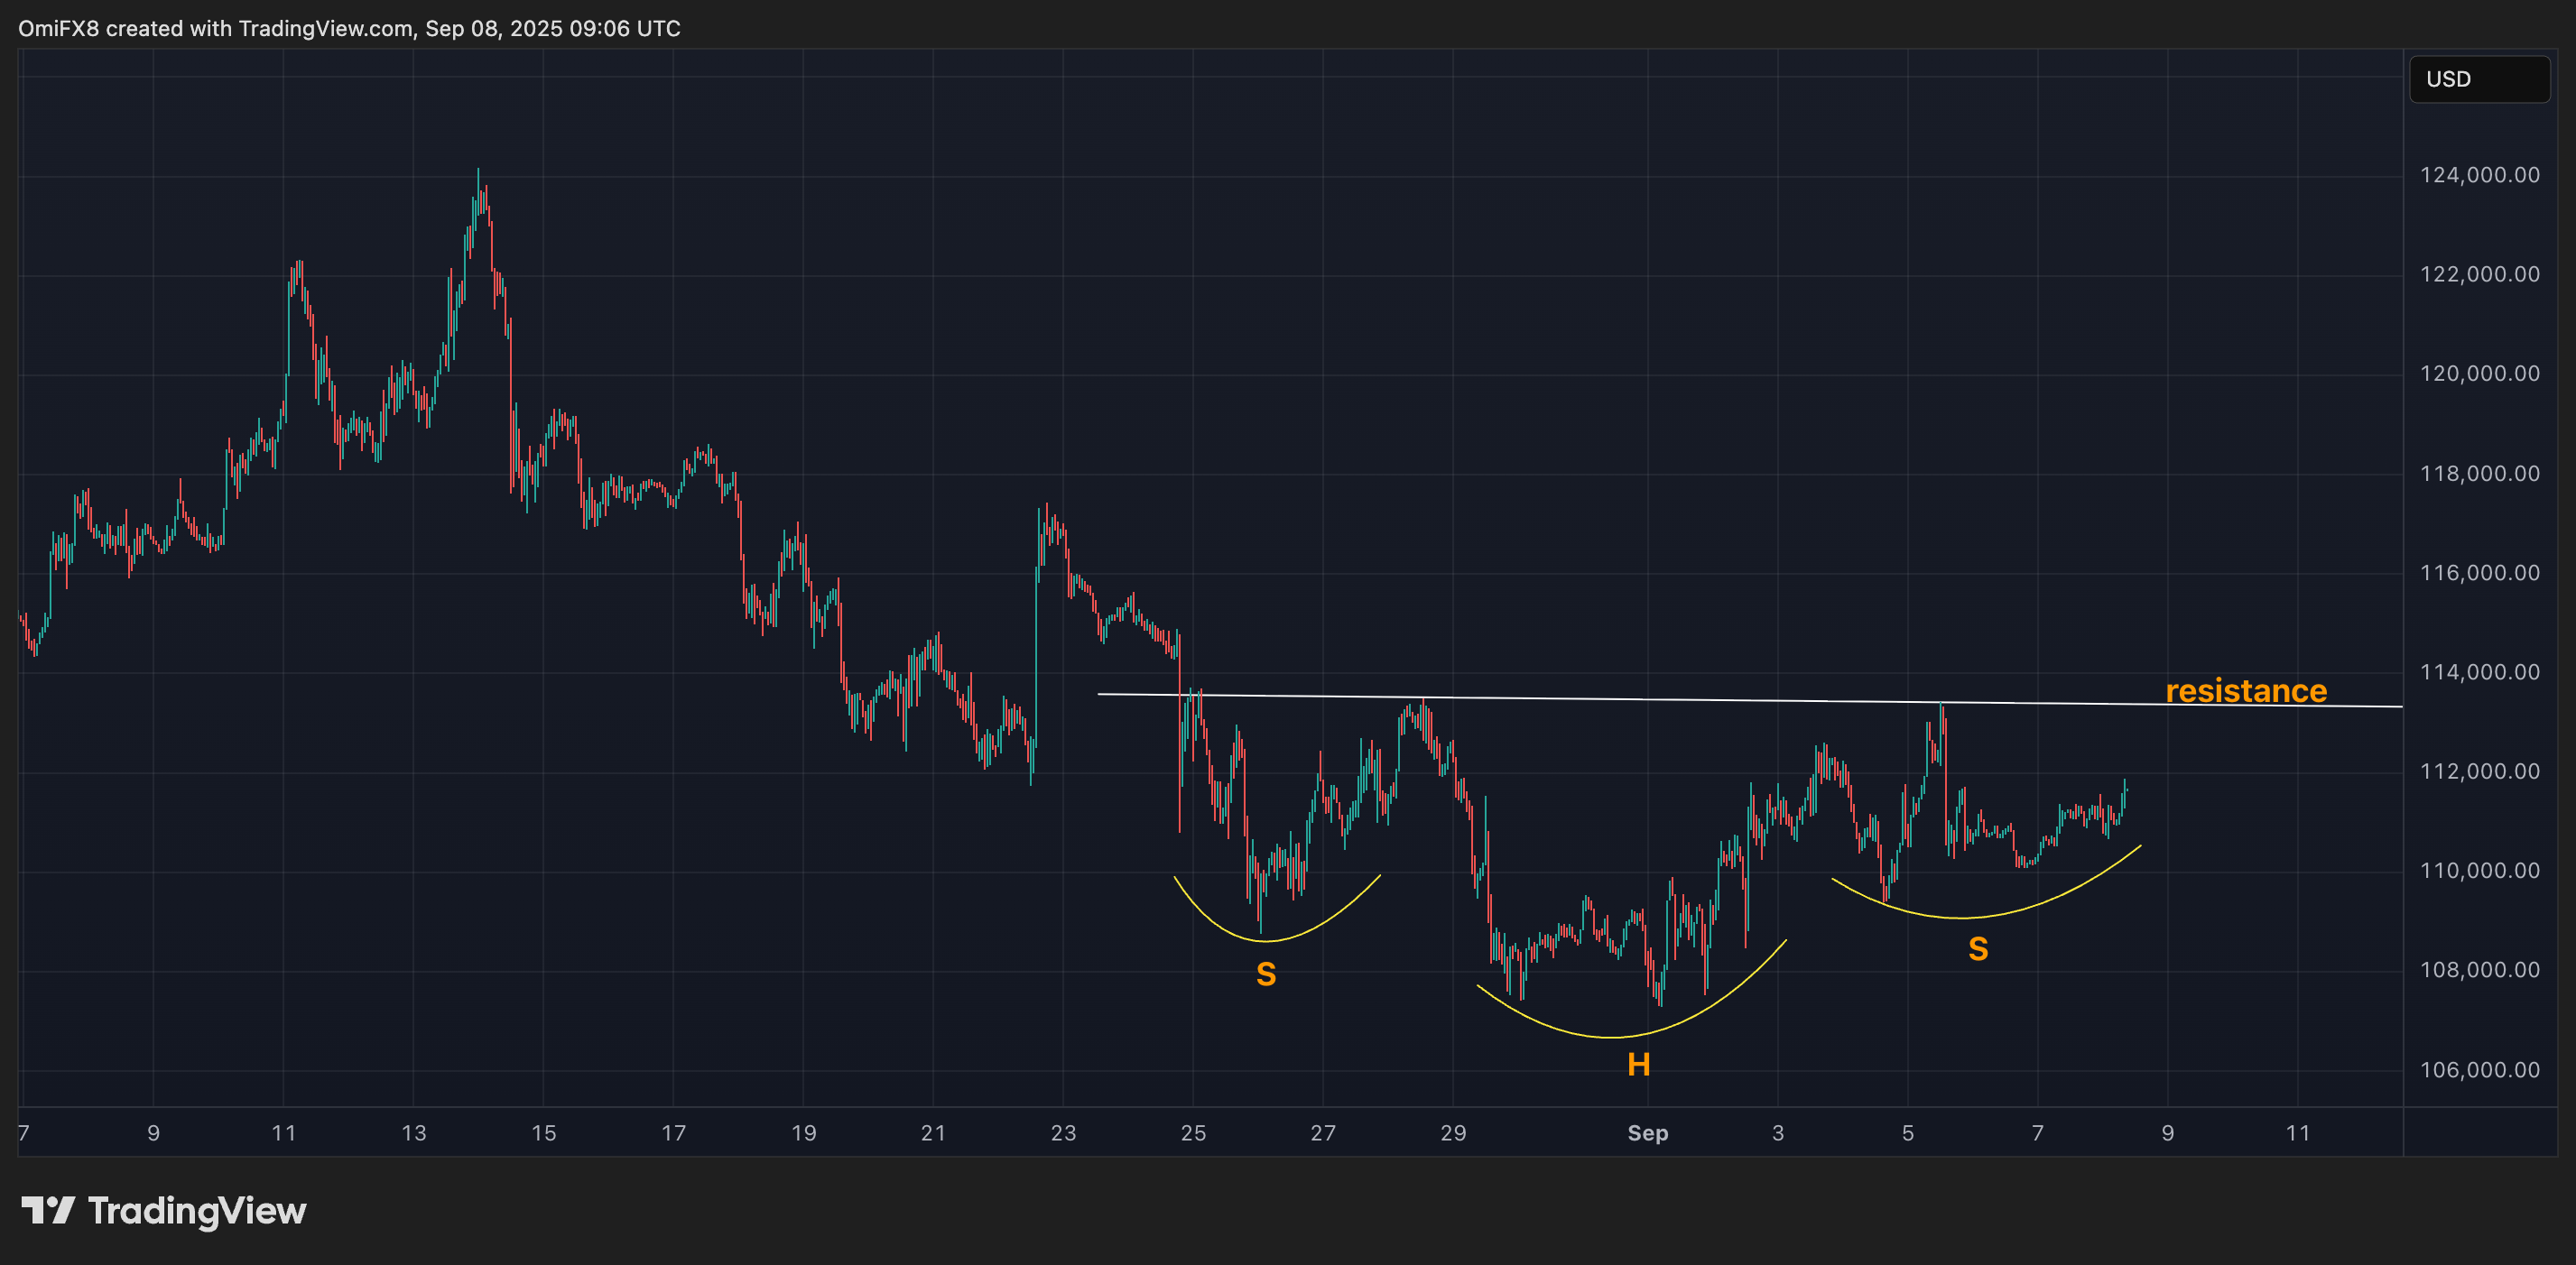
The pattern would be invalidated in case of a move below $107,300, reinforcing the bearish setup on the daily chart. In that case, the focus would shift to the 200-day simple moving average support NEAR $101,850.
Read:
