Red September Alert: Bitcoin Faces Potential Slide to $100K After 6% Monthly Plunge

Bitcoin's September stumble sparks fresh volatility concerns as the flagship cryptocurrency posts a 6% monthly decline—raising eyebrows about potential further downside.
Technical Pressure Mounts
The drop puts Bitcoin's near-term trajectory in question, with some analysts flagging the $100K level as a critical psychological and technical threshold. Market sentiment shifts as traders weigh macroeconomic signals against crypto-specific catalysts.
Institutional Whispers Grow Louder
While retail holders sweat the drawdown, institutional players are monitoring entry points—because nothing says 'strategic accumulation' like watching retail panic sell. Traditional finance veterans might scoff, but the digital gold narrative isn’t fading quietly.
Volatility Isn’t Going Anywhere
Expect choppy price action as the market digests Fed policy nuances, regulatory murmurs, and the ever-present leverage flush risk. September’s red doesn’t necessarily mean Q4 despair—but it’s a stark reminder that crypto doesn’t do quiet months.
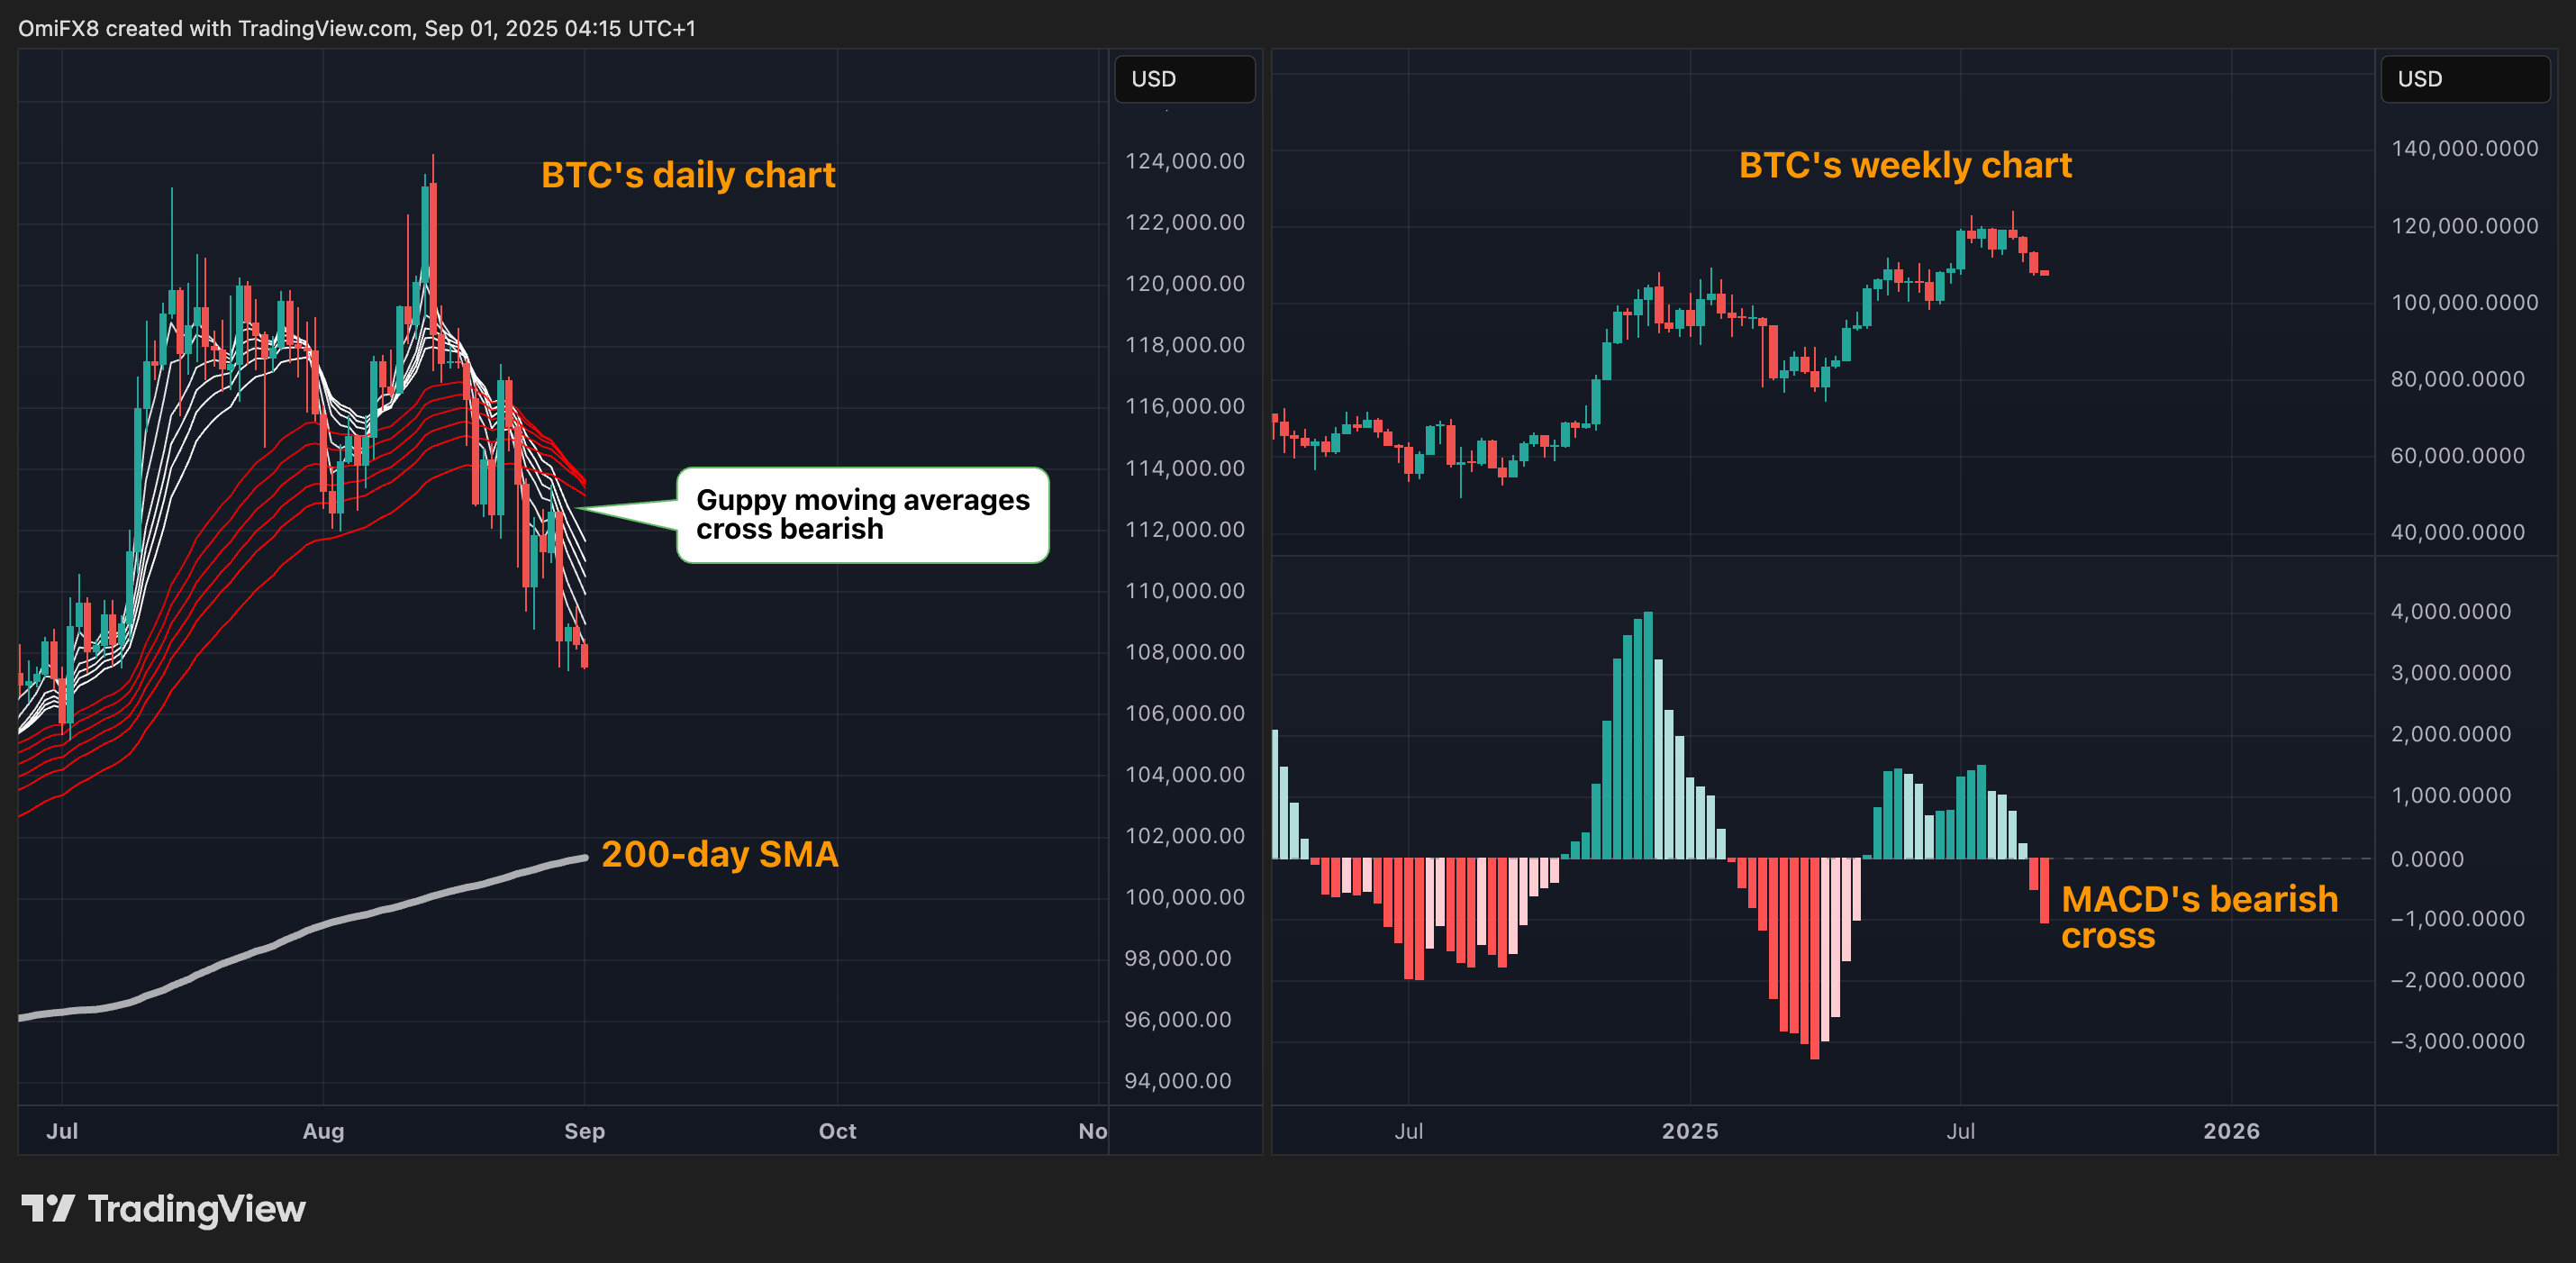
These breakdowns underscore growing market weakness, confirming a bearish shift in key momentum indicators such as the Guppy Multiple Moving Average (GMMA) and the MACD histogram.
The short-term exponential moving average (EMA) band of the GMMA (green) has crossed below the longer-term band (red), signaling a clear bearish momentum shift. Meanwhile, the weekly MACD histogram has dropped below zero, indicating a transition from a bullish to a bearish trend.
Together, these signals indicate a likelihood of a sustained sell-off, potentially driving the price down to the 200-day simple moving average (SMA) at $101,366, and possibly to the $100,000 mark.
Bearish seasonality
The negative technical outlook aligns with seasonal trends, which show September historically as a bearish month for bitcoin. Since 2013, BTC has delivered an average return of -3.49%, closing lower in eight of the past 12 September months, according to data from Coinglass.
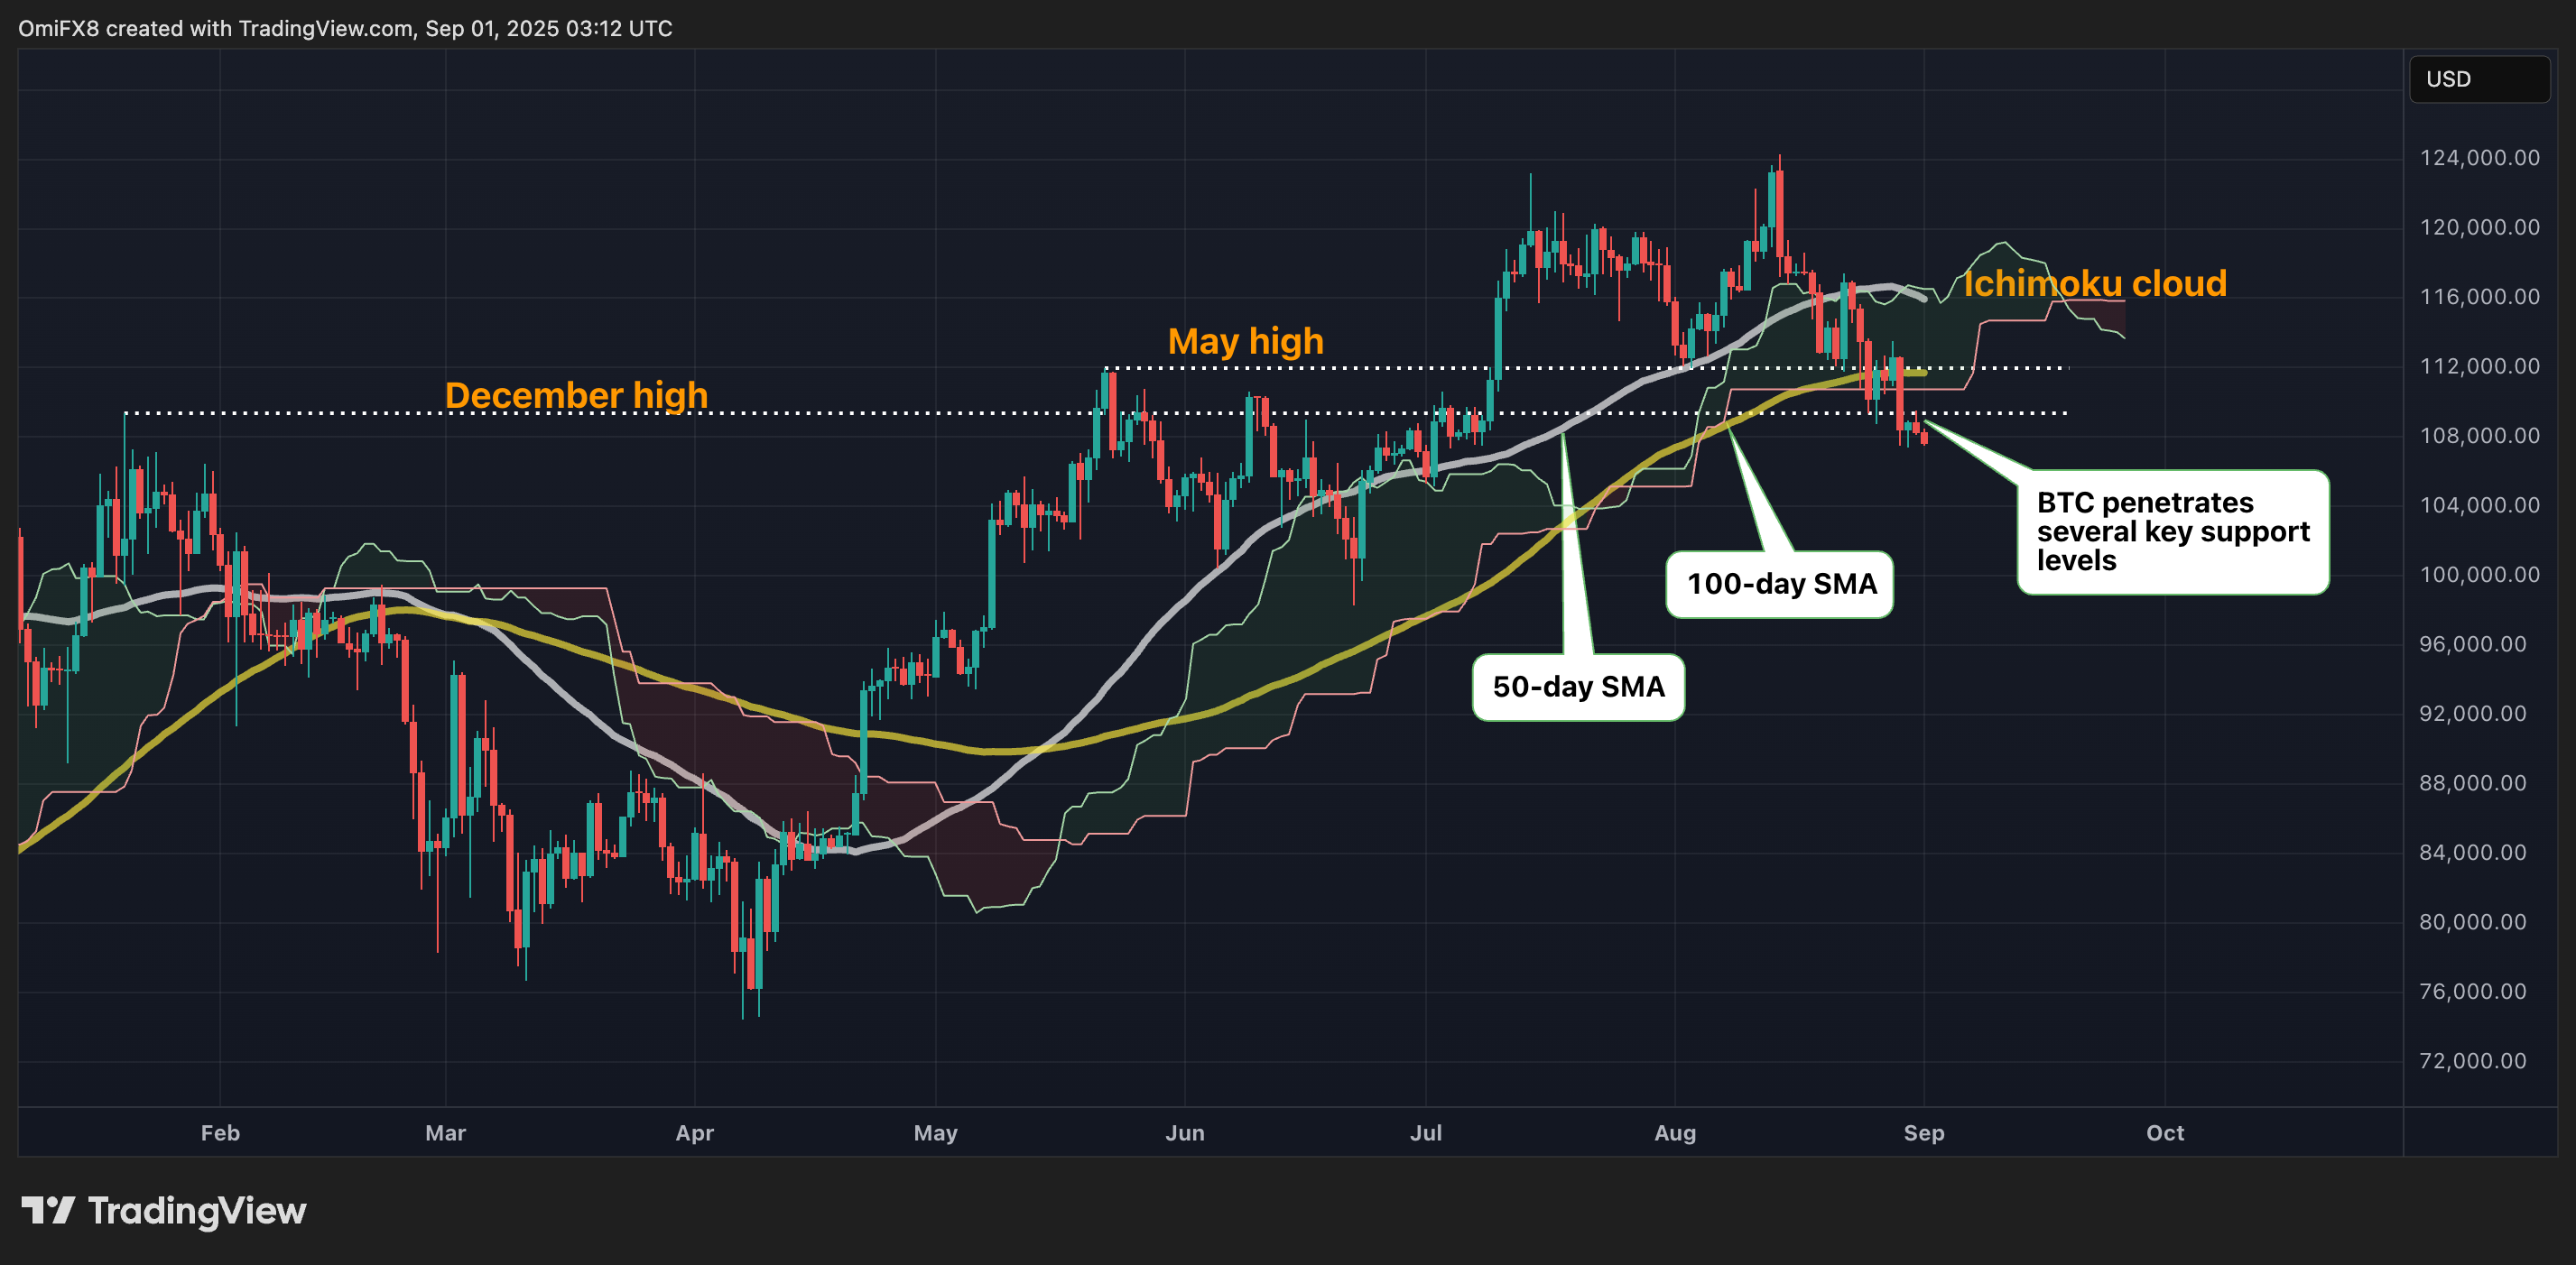
As for bulls, overcoming the lower high of $113,510 set on Aug. 28 is crucial to negating the bearish outlook.
- Support: $105,240 (the 38.2% Fib retracement of the April-August rally), $101,366 (the 200-day SMA), $100,000.
- Resistance: $110,756 (the lower end of the Ichimoku cloud), $113,510 (the lower high), $115,938 (the 50-day SMA).
