🚀 Bitcoin Cash Soars 5% as It Prints Bullish Golden Cross Against Bitcoin – Is the Flip Coming?

Bitcoin Cash isn’t just rallying—it’s staging a technical coup. A 5% surge against BTC paired with a golden cross? That’s the kind of chart drama that gets traders double-tapping their screens.
### The Golden Cross Heist
When BCH’s 50-day MA punches above its 200-day MA against Bitcoin, it’s not just a bullish signal—it’s a middle finger to the 'digital gold' narrative. Suddenly, that 'store of value' debate gets spicy.
### Liquidity Likes a Showoff
No new data? No problem. The market’s pricing in what the charts scream: Bitcoin Cash might be the altcoin actually trying to solve payments—while BTC maximalists argue about laser eyes and inflation hedges. (Spoiler: both can be wrong.)
### The Cynic’s Corner
Let’s be real—half the 'bullish signals' in crypto get wrecked faster than a leveraged trader on margin. But a golden cross with actual price momentum? That’s rare enough to make even Wall Street’s chart guys glance up from their Excel sheets.
Key AI insights
- In the last 24 hours from June 30, 13:00 to July 1, 12:00, BCH exhibited a significant bullish trend, climbing from $491.25 to $519.65, representing a 5.8% gain.
- The price range during this period was $37.80 (7.7%), with BCH reaching a peak of $527.37 at 03:00 on July 1 following exceptional volume support.
- Key resistance formed around $527 with multiple tests, while support was established at $519-$520, suggesting continued bullish momentum despite the minor pullback.
- Over 120,000 BCH changed hands at 01:00—nearly triple the 24-hour average volume, indicating strong buyer interest.
- In the last 60 minutes from 1 July 11:30 to 12:29, BCH experienced significant volatility, initially climbing 0.55% from $519.67 to $522.55 by 11:57, before sharply declining 0.71% to close at $518.85.
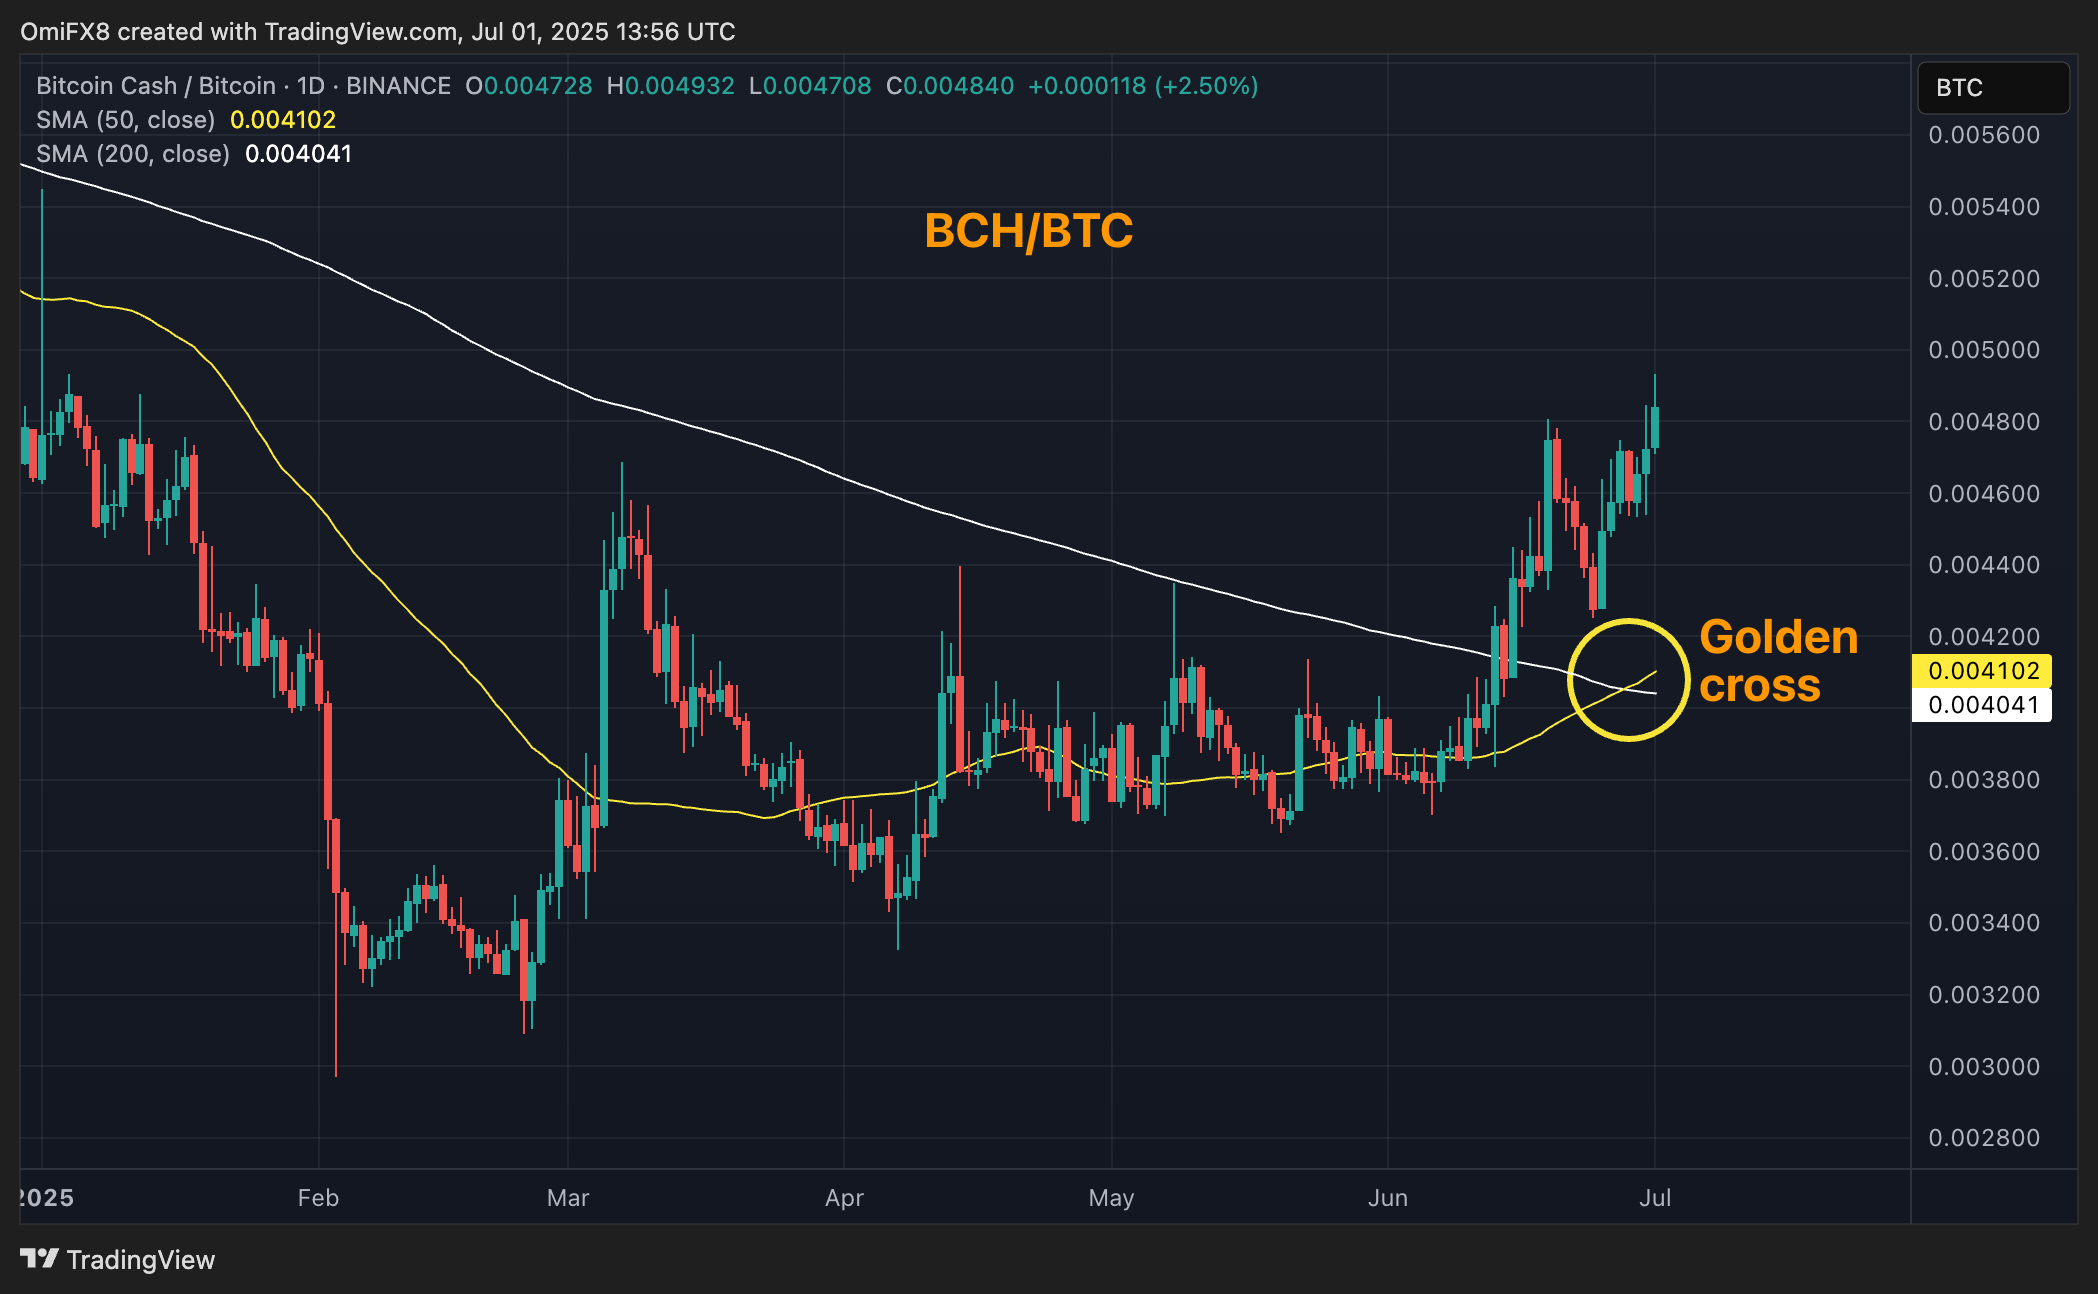
BCH/BTC chalks out golden cross
The Binance-listed bitcoin cash-bitcoin (BCH/BTC) pair, which tracks the ratio between the prices of BCH and BTC, has risen nearly 20% in four weeks, hitting a six-month high of 0.0049, according to data source TradingView.
BCH's outperformance is gathering momentum as evidenced by the bullish golden crossover of the 50-day simple moving average (SMA) crossing above the 200-day SMA.
The pattern indicates that short-term momentum is now outperforming the broader trend, with the potential to evolve into a significant bull market.

Log in to Reply
Log in to comment your thoughtsComments
Related Articles
|Square
Get the BTCC app to start your crypto journey
Get started today Scan to join our 100M+ users