Dollar Index Plunges Most Since 1991—Bitcoin’s Stochastic Flashing Warning Signs of Sub-$100K Drop

The dollar just got wrecked. The DXY index logged its worst single-day collapse in 34 years—and Bitcoin's technicals hint at even wilder turbulence ahead.
Stochastic signals scream 'overbought'
That jittery momentum indicator—beloved by traders who enjoy self-inflicted pain—now points to a potential nosedive below the psychological $100K level. Perfect timing for another round of 'buy the dip' memes while Wall Street recalculates its inflation models... again.
Blood in the water for fiat, fireworks for crypto
When the world's reserve currency stumbles this hard, digital assets don't just rally—they moonshot. Unless, of course, that stochastic reading actually means something this time. Place your bets before the Fed starts jawboning about 'transitory' crashes.
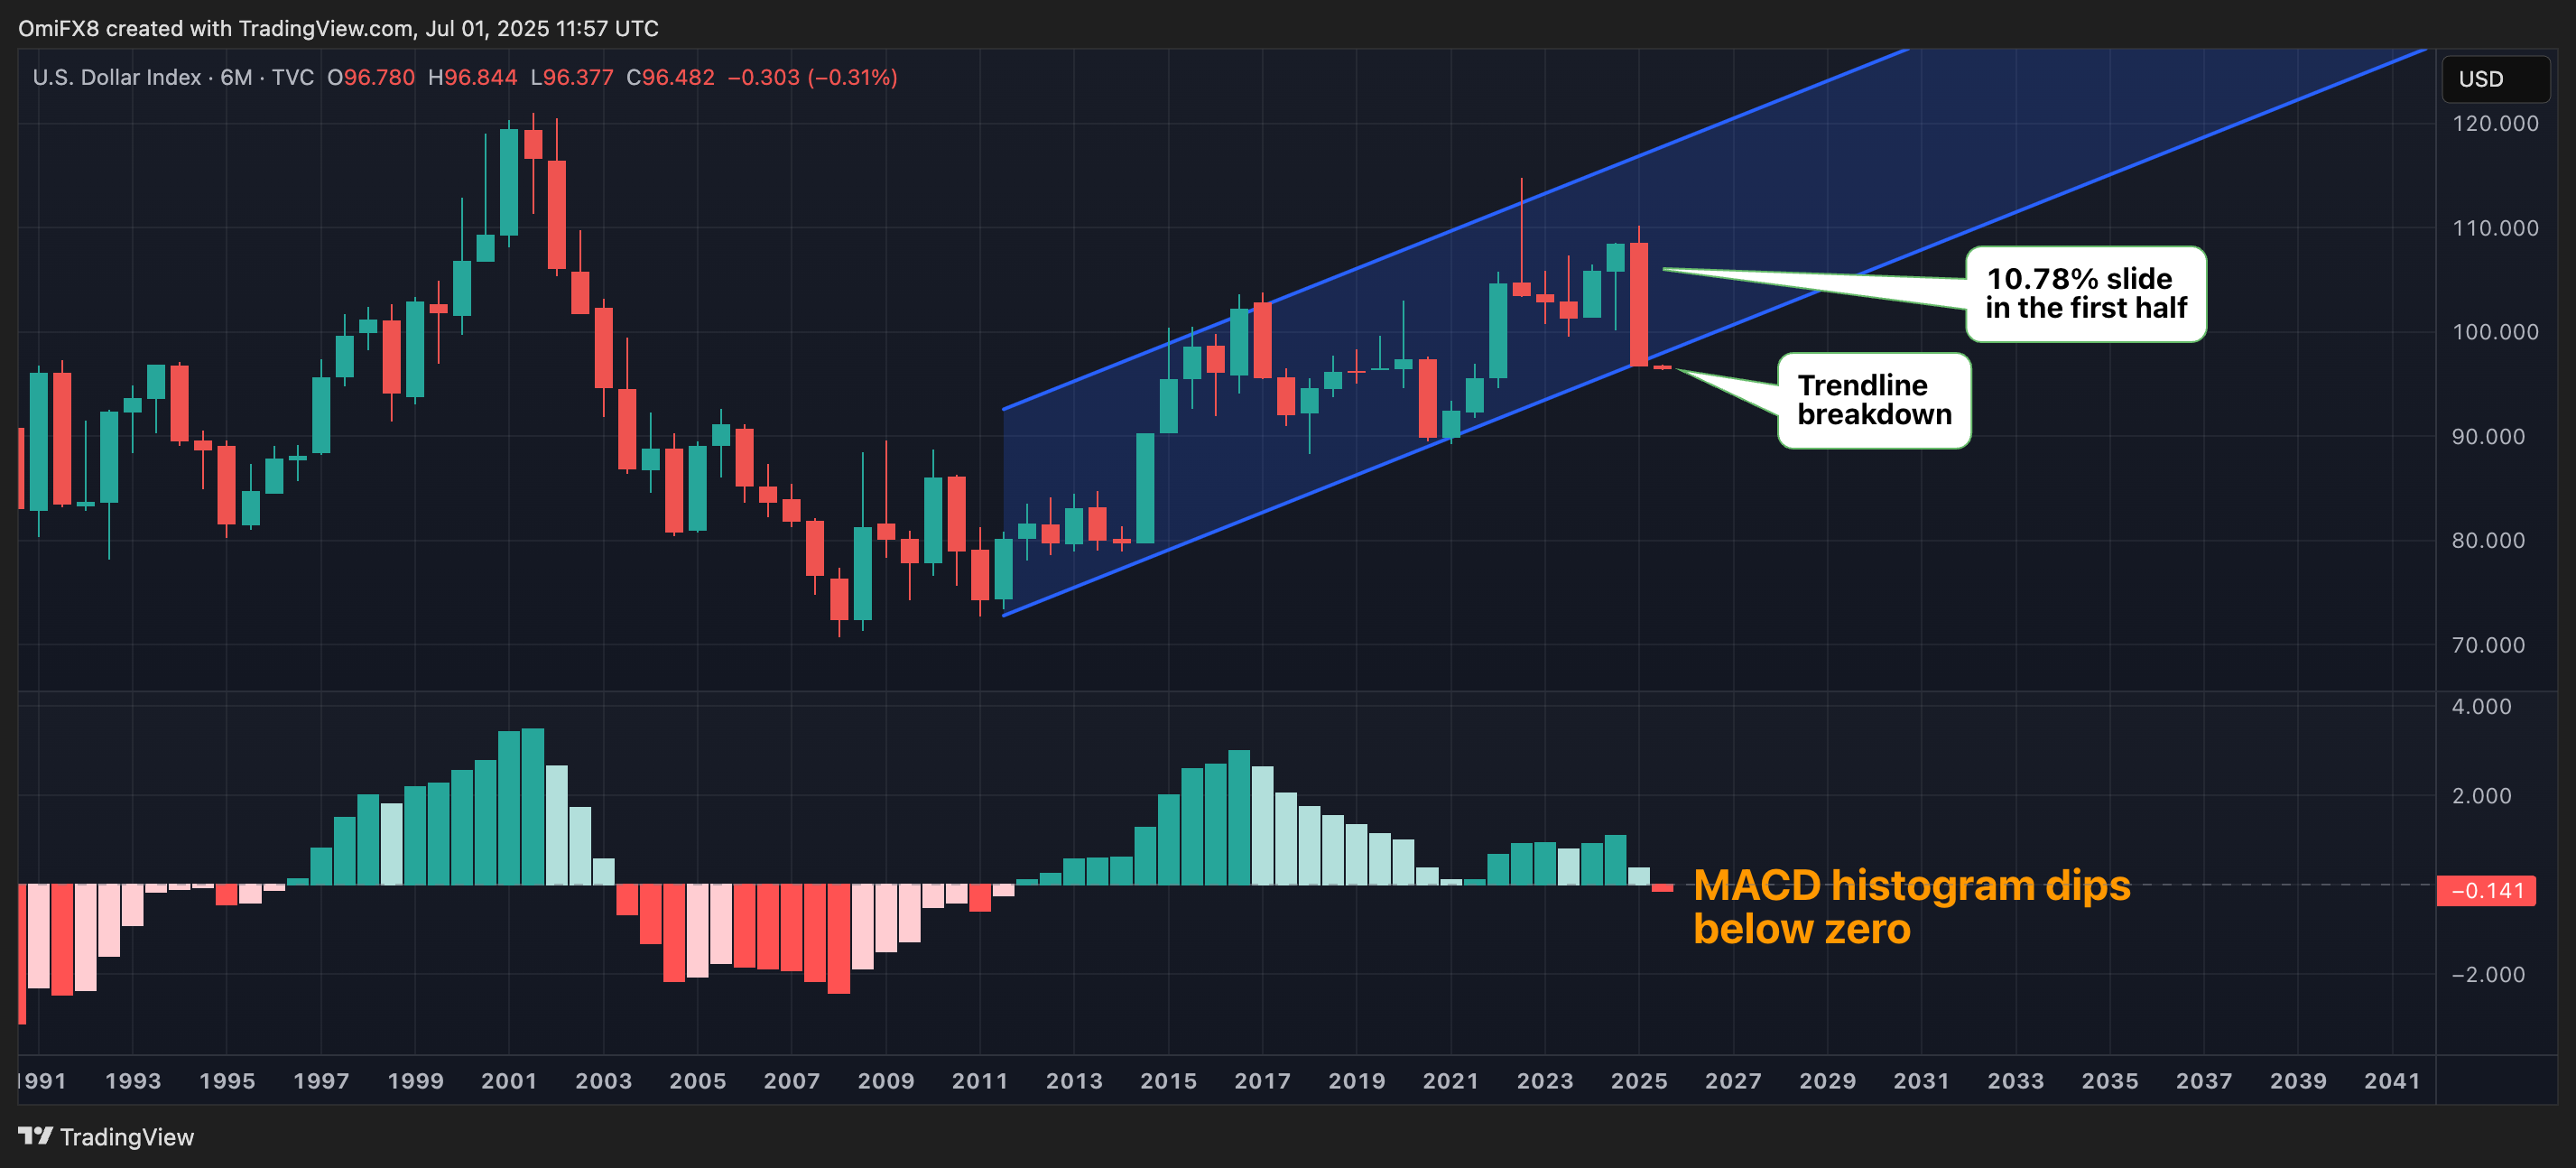
The trendline breakdown, coupled with the negative MACD, suggests a strengthening of bearish momentum and points to further losses ahead.
"Looks like USD could drop another 10% easily....and maybe a lot more in the next 12-24 months," Dan Tapiero, founder and CEO of DTAP Capital, said on X, calling it a bullish tailwind for bitcoin.
BTC faces sell-off risks
Bitcoin's short-term technicals, particularly the ongoing price action relative to the stochastic indicator, paint a bleak picture. BTC fell 1% on Monday, turning lower from the upper end of the bull flag countertrend consolidation carved out over the past six weeks.
In such conditions, traders typically use oscillators, such as the stochastic, to confirm whether the rejection at the upper boundary of the ongoing consolidation has set the stage for a renewed slide to the lower end.
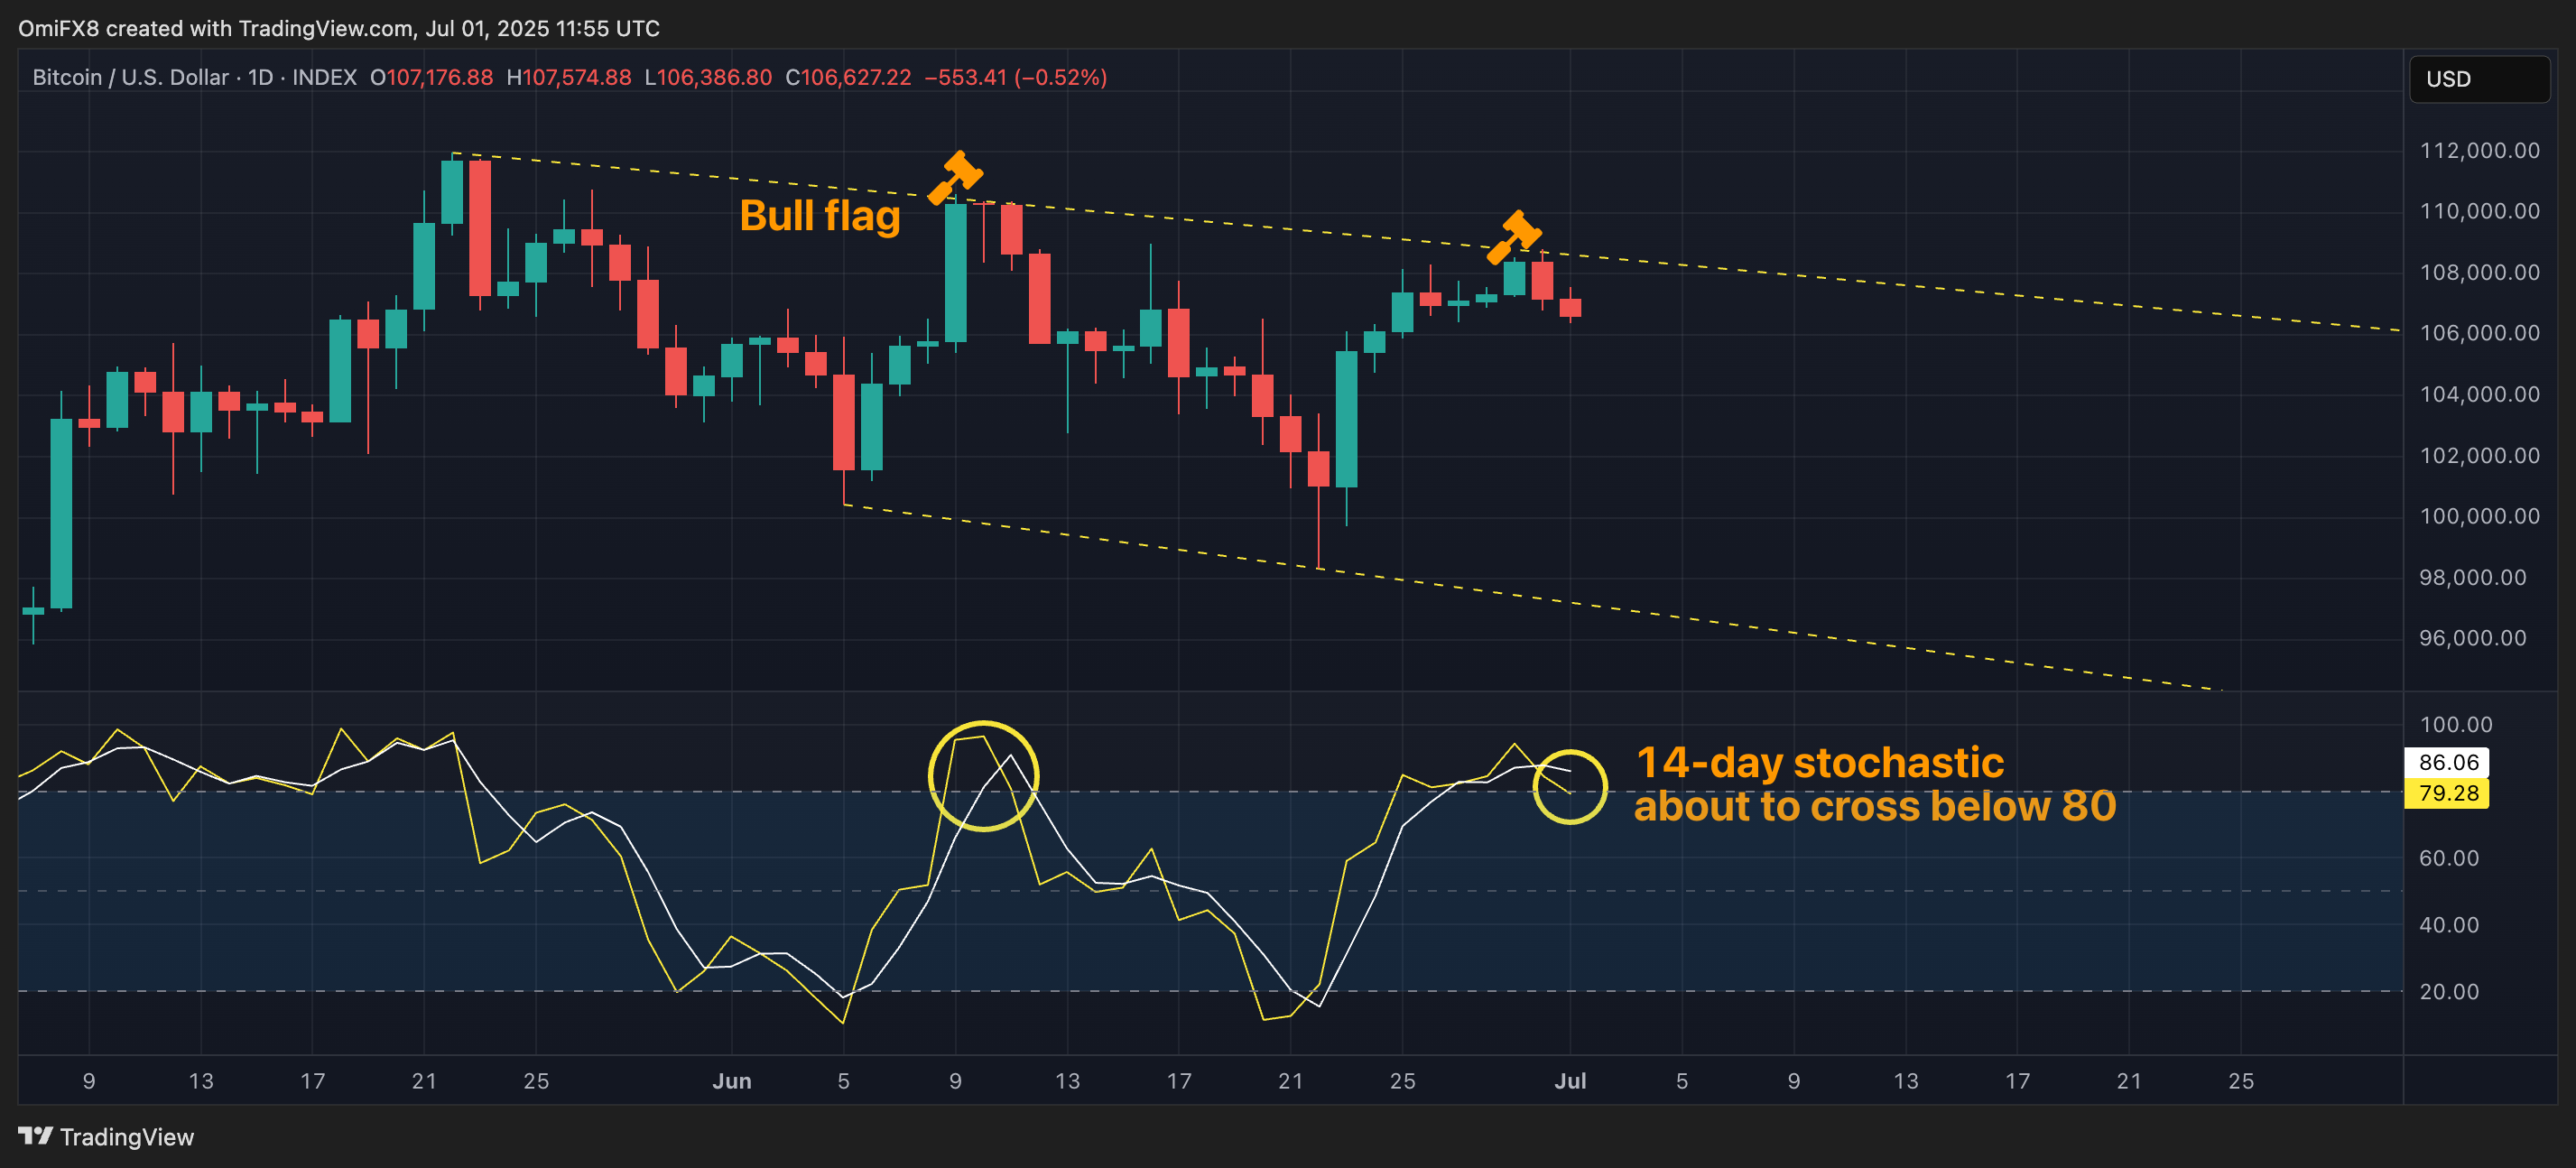
In BTC's case, the 14-day stochastic confirms the same, repeating the pattern seen in the first half of June. The oscillator is on the verge of crossing below 80, marking a downturn from the overbought region to suggest renewed sell-off within the broad price range.
In other words, BTC could revisit sub-$100,000 in the short term. A firm MOVE above the upper end of the consolidation will invalidate the bearish signal, setting the stage for a rally to $140,000.
