XRP Mirrors Explosive Bullish Pattern That Propelled BTC to $100K—History Repeating?

XRP just flashed a chillingly familiar chart formation—one that last appeared right before Bitcoin's historic surge past $100,000. Market veterans are snapping to attention.
The ghost of rallies past
That ascending triangle breakout? The same technical setup that lit the fuse on BTC's legendary 2021 bull run. Now XRP's price action is tracing an uncanny parallel—down to the volatile retests of support that typically precede massive upside.
Wall Street's déjà vu moment
Institutional traders who missed Bitcoin's breakout are reportedly piling into XRP derivatives this time. 'The pattern's too clean to ignore,' quips one hedge fund manager between sips of his $28 cold brew. 'Though frankly, we'd all prefer if the SEC stopped treating crypto charts like Rorschach tests.'
While the technicals scream opportunity, remember: past performance doesn't guarantee future results—especially in a market where 'fundamentals' sometimes means which celebrity meme coin Elon tweets about next.
XRP defies bearish MACD histogram
The underlying strength in XRP is evident from the way prices have been behaving relative to the MACD histogram in recent weeks.
The moving average convergence divergence (MACD) histogram is an exponential moving average (EMA)--based trend-following indicator widely tracked by both institutions and retail investors to identify price trends and measure trend momentum.
The MACD bars crossing from negative to positive indicate a bullish shift in momentum, suggesting the start of an uptrend in the asset's price. A crossover below zero suggests otherwise, with consecutive deeper bars indicating a strengthening of the downward momentum.
XRP's weekly chart MACD, used by traders to gauge long-term trends, crossed below zero in the first week of March, signaling a renewed downtrend.
However, a pronounced downtrend has not yet materialized, with prices mainly trading back and forth between $2 and $2.60, barring occasional short-lived dips below $2.
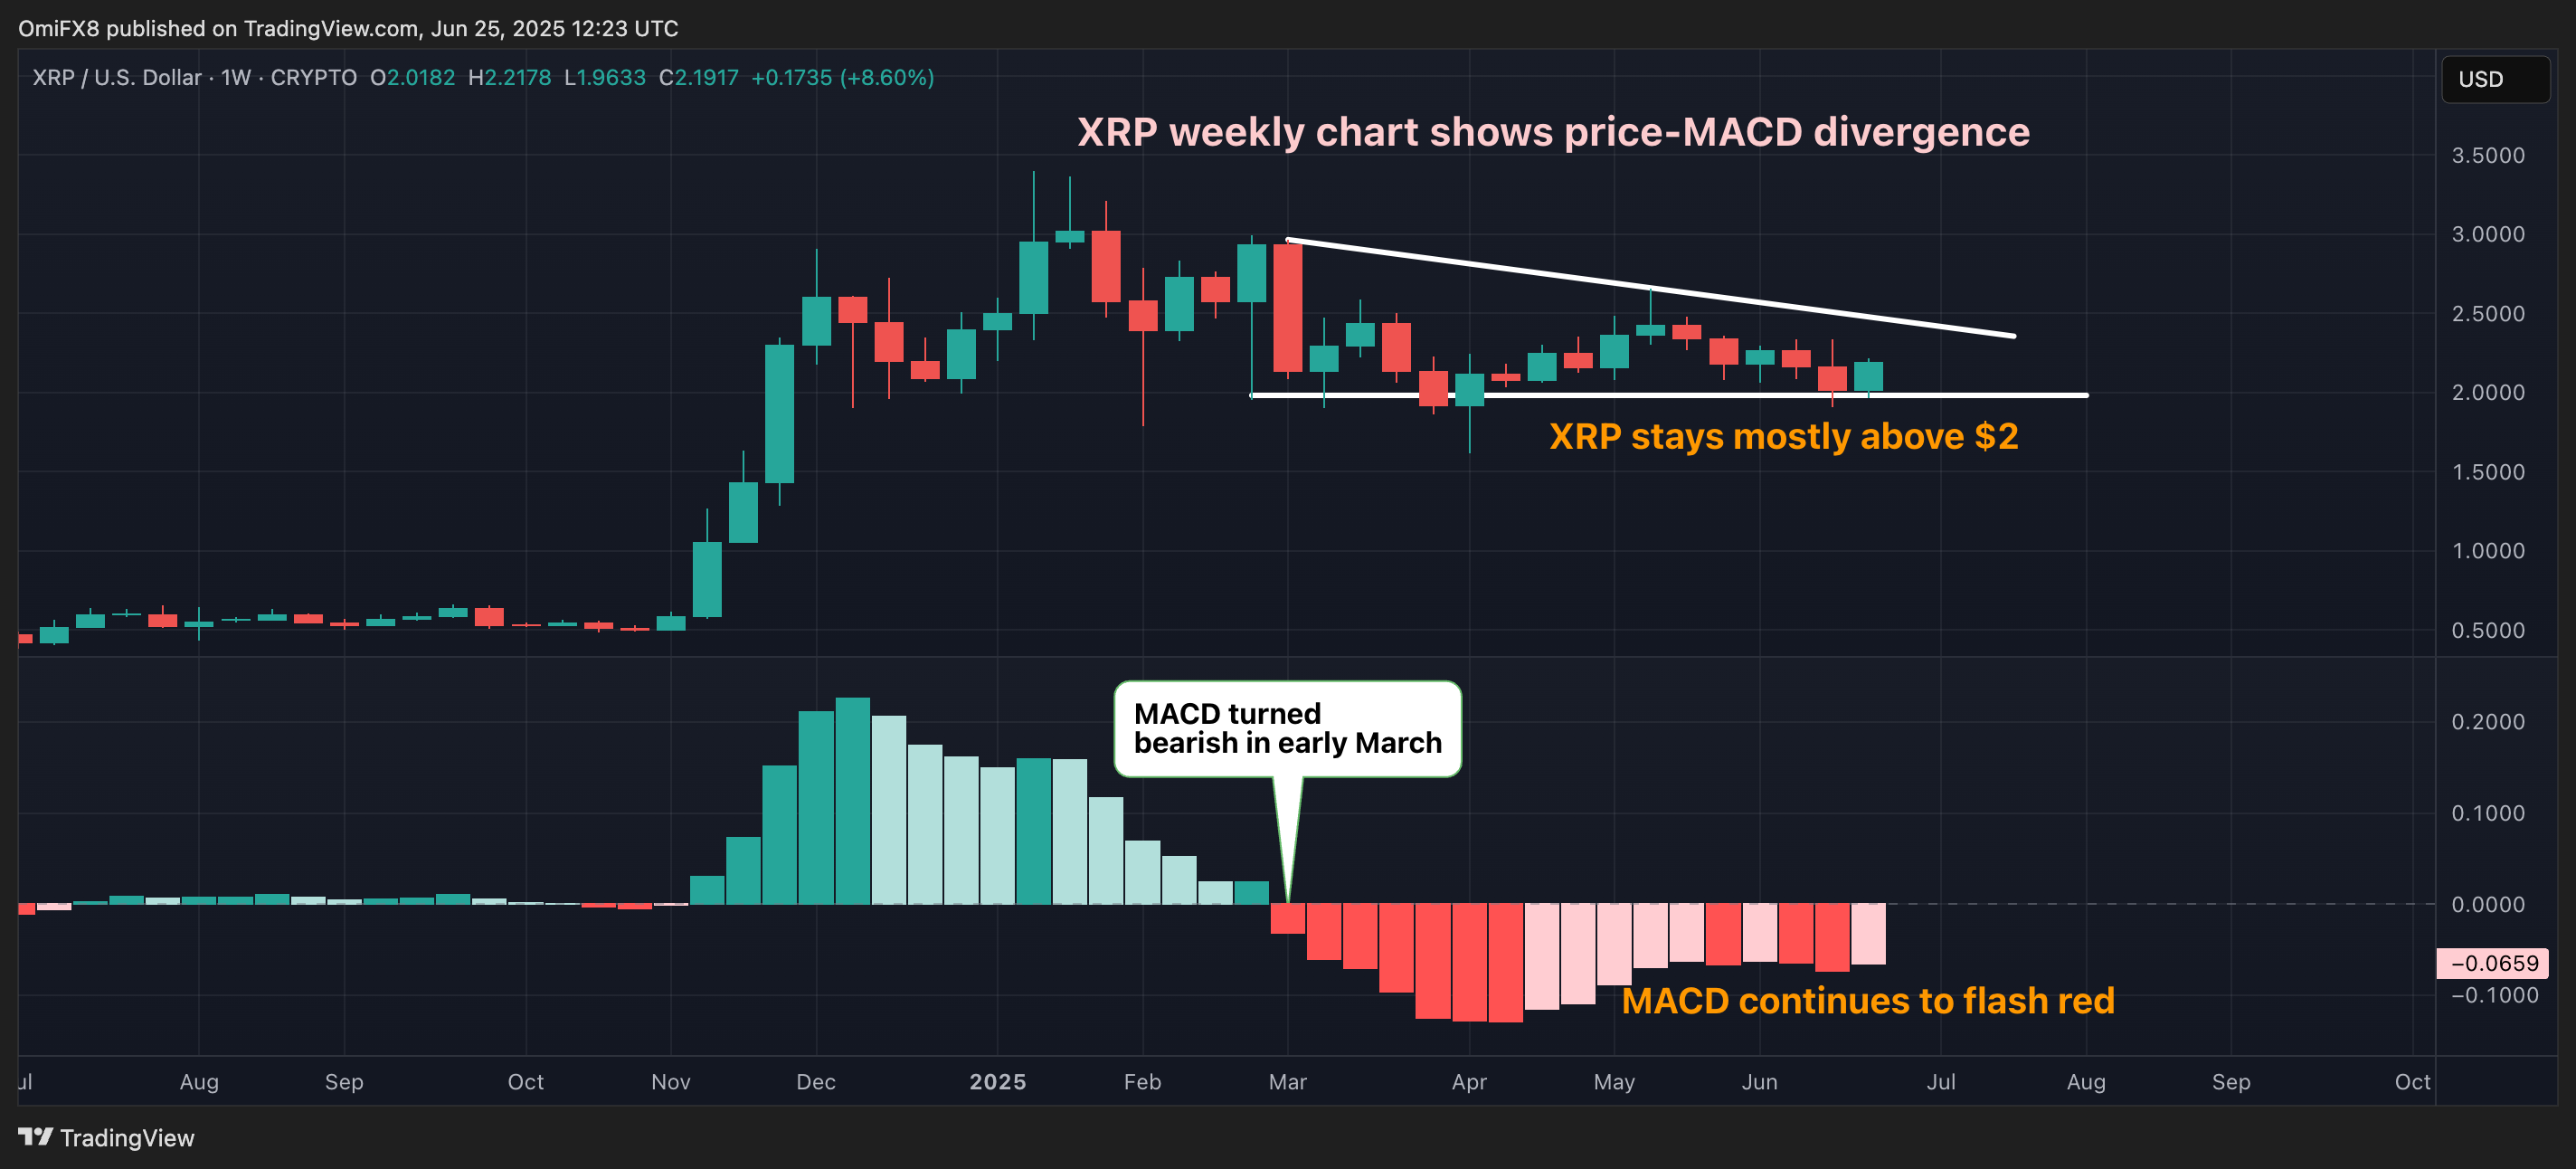
The divergence, marked by persistently bearish MACD and largely directionless trading, hints at bullish vibes or resilience beneath the surface – bulls successfully absorbing supply.
This prolonged divergence means the potential for a sudden bull revival and price increases. The bull case is supported by the upward-sloping 50-, 100- and 200-week simple moving averages (SMA).
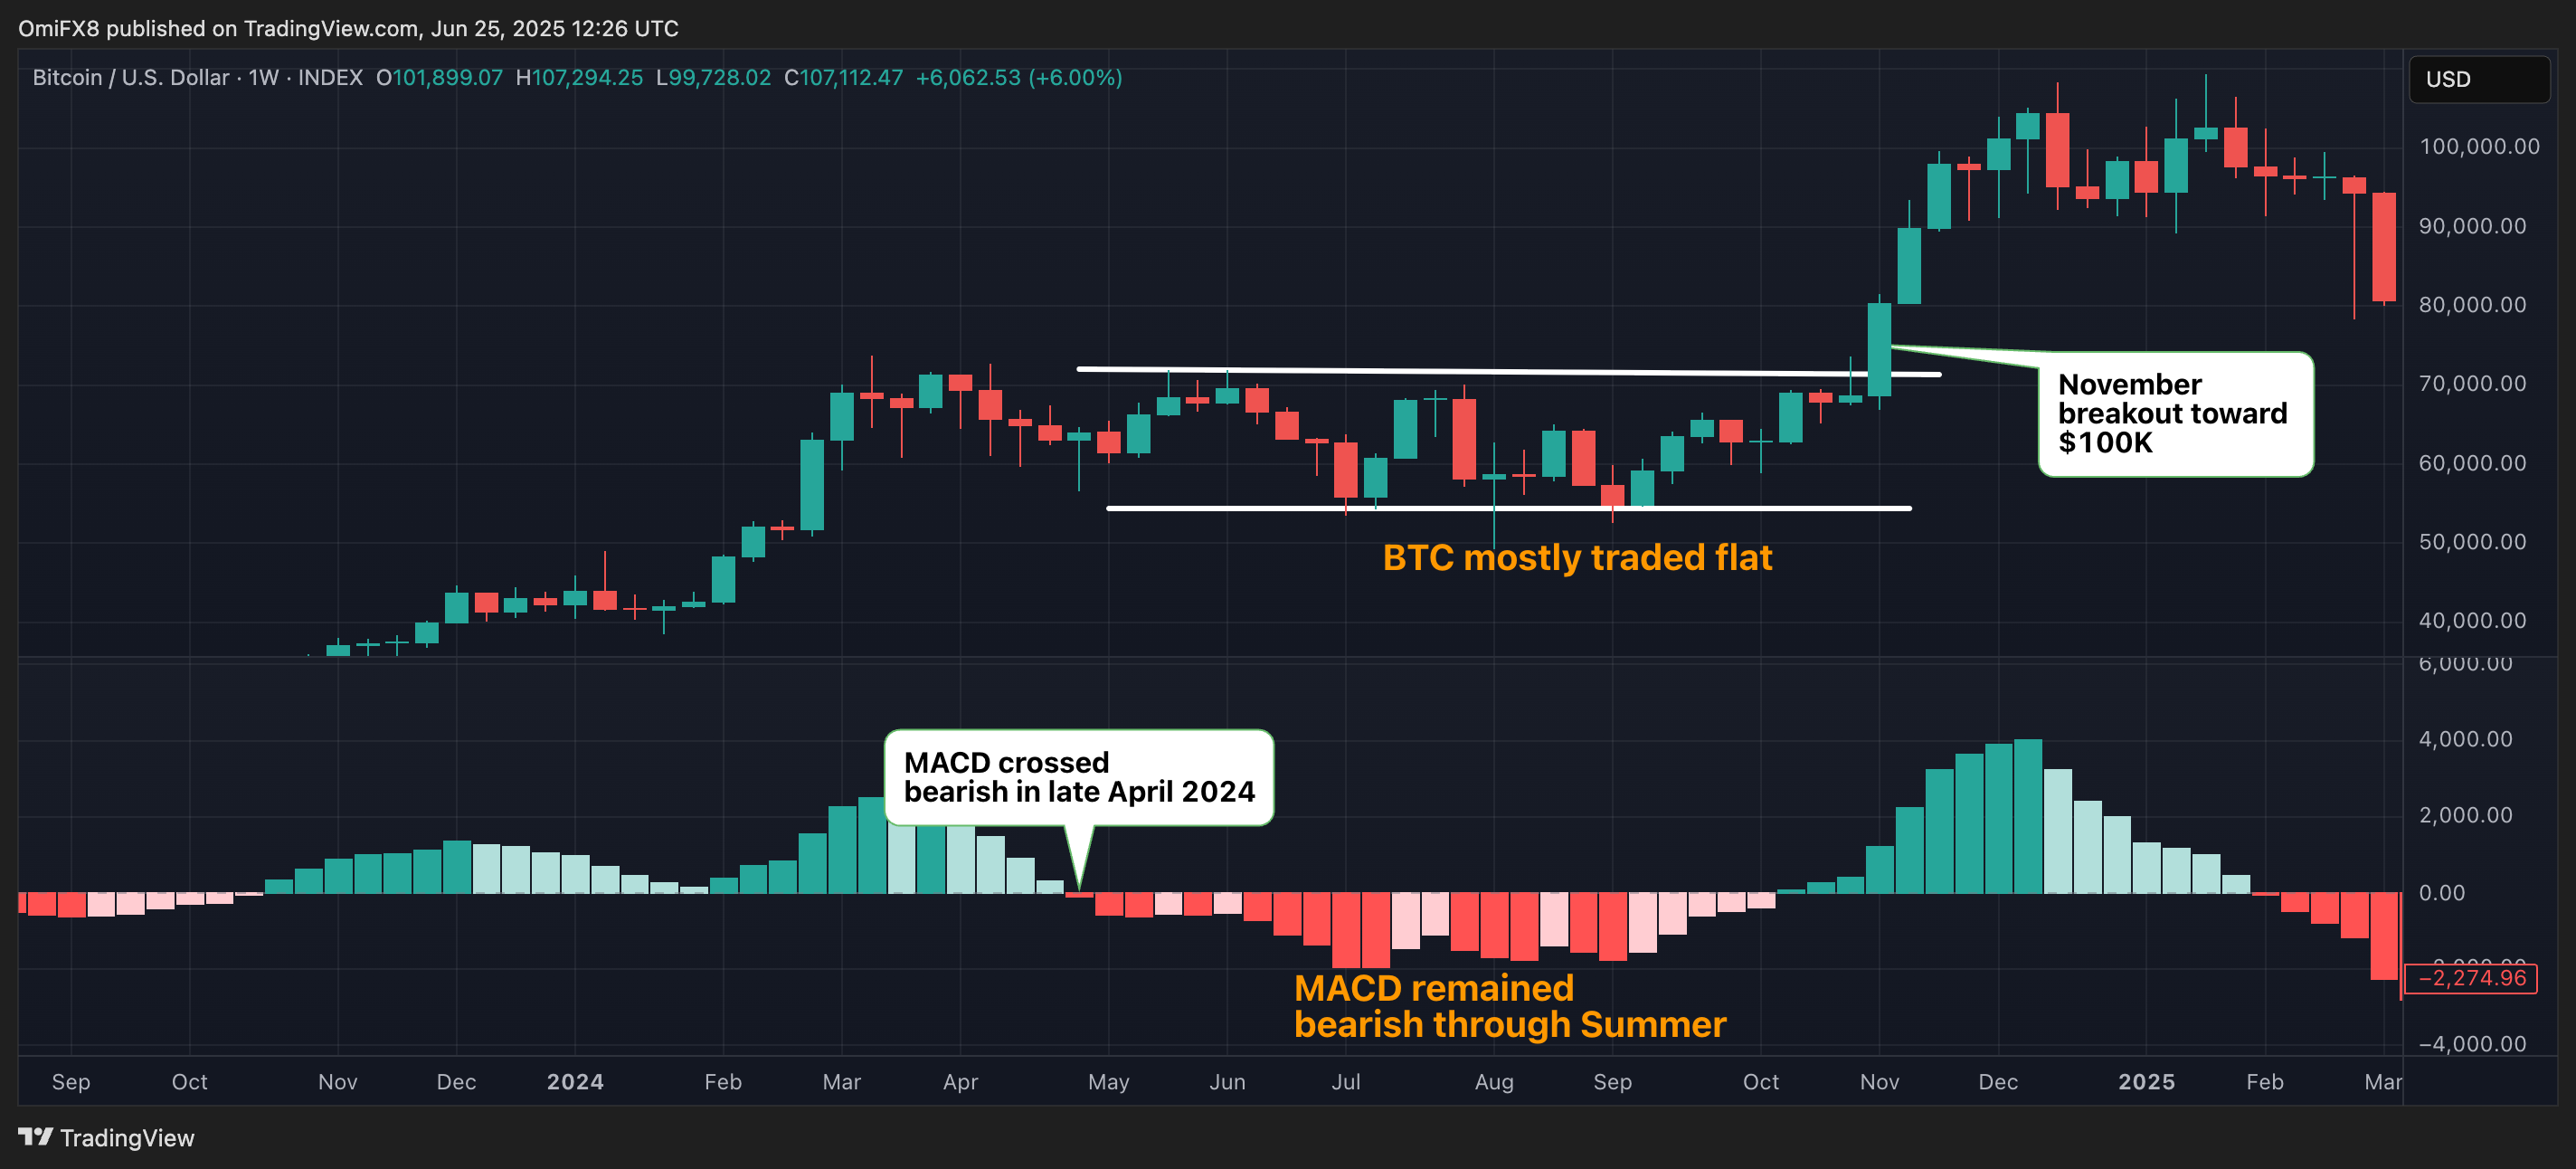
BTC defied bearish MACD in 2024
The above-discussed divergence in XRP is similar to the conditions in BTC last year when the weekly MACD kept flashing red throughout the Summer. At the same time, BTC traded range-bound, barring occasional short-lived dips below $60,000.
CoinDesk noted the divergence in mid-September last year when BTC changed hands at around $59,000. Weeks later, BTC ROSE to $70,000, eventually topping the same in November to hit record highs above $100,000.
Let's see if XRP follows the same path.