Bitcoin Flirts With 2021-Style Double Top—Here’s Why Traders Should Care

Deja vu? Bitcoin’s price action is tracing an eerily familiar pattern—the double-top formation that preceded its 2021 bull run collapse. Market veterans are eyeing the charts like hawkish Fed chairmen scanning inflation data.
Key signals flashing: The $69K resistance level just got rejected harder than a bank loan application with a 400 credit score. Meanwhile, derivatives markets show leveraged longs piling in like Wall Streeters at a free buffet.
The bullish case isn’t dead—institutional inflows via spot ETFs could rewrite the script. But right now? This looks like a high-stakes rerun of crypto’s greatest hits. Buckle up.
A deeper dive
The first of those metrics is weekly RSI, which is exhibiting three strikes of bearish divergence from March 2024, December 2024 and May 2025. RSI is an indicator that compares averages gains with average losses over a set period to gauge potentially overbought or oversold conditions. Bearish divergence is where RSI is trending to the downside whilst price is trending to the upside.
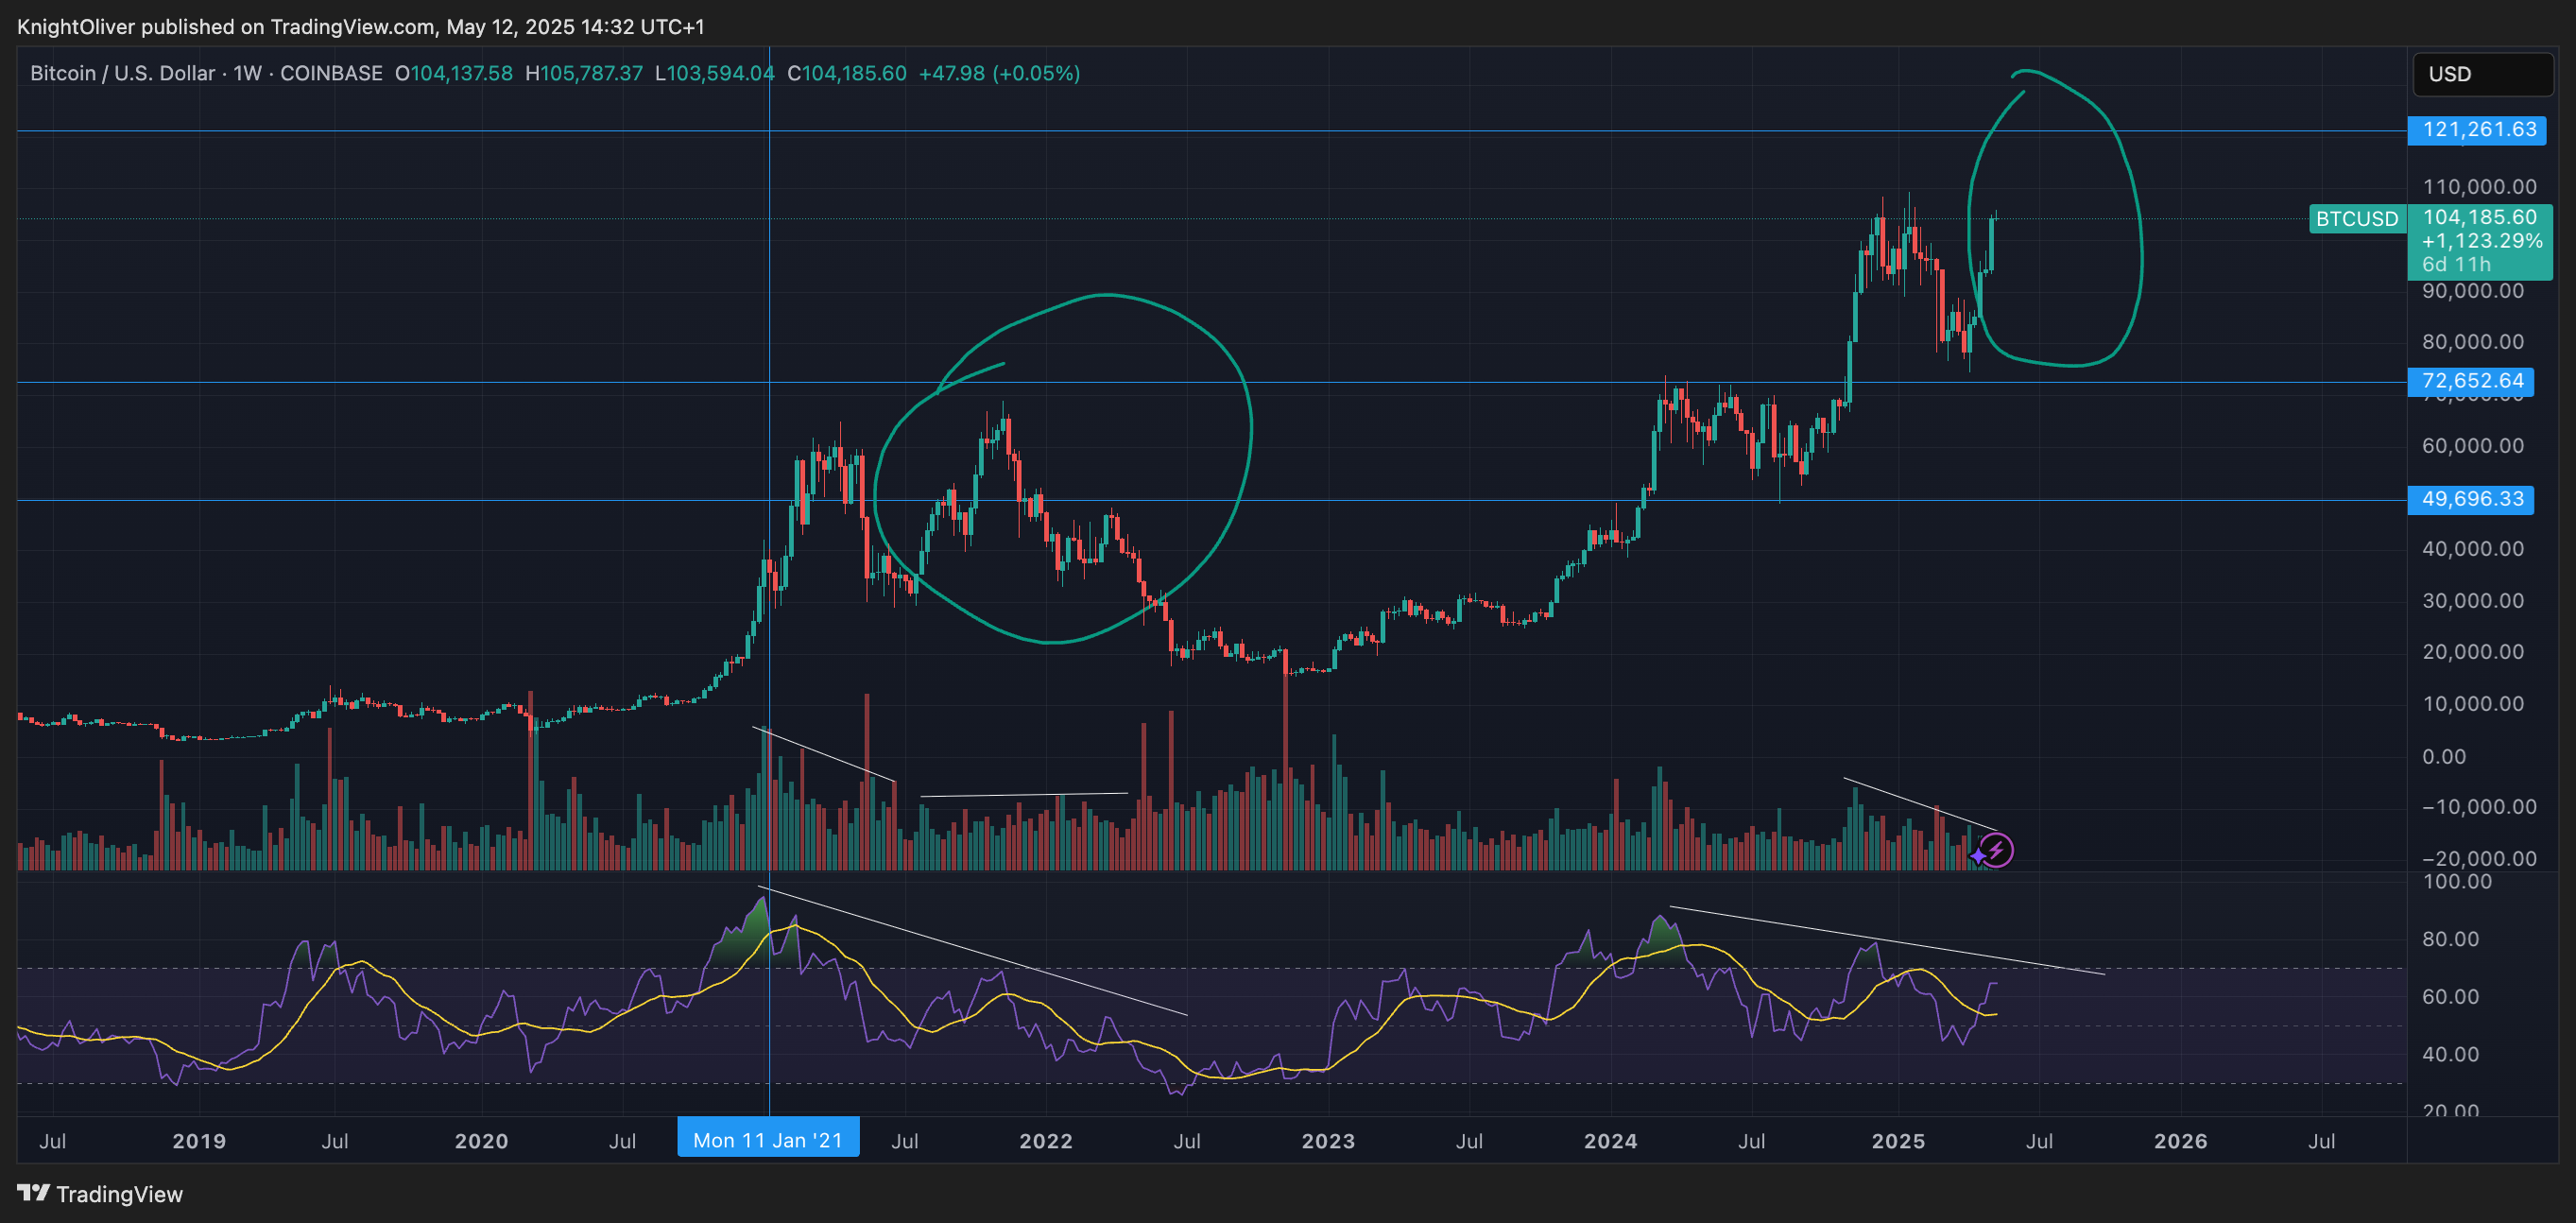
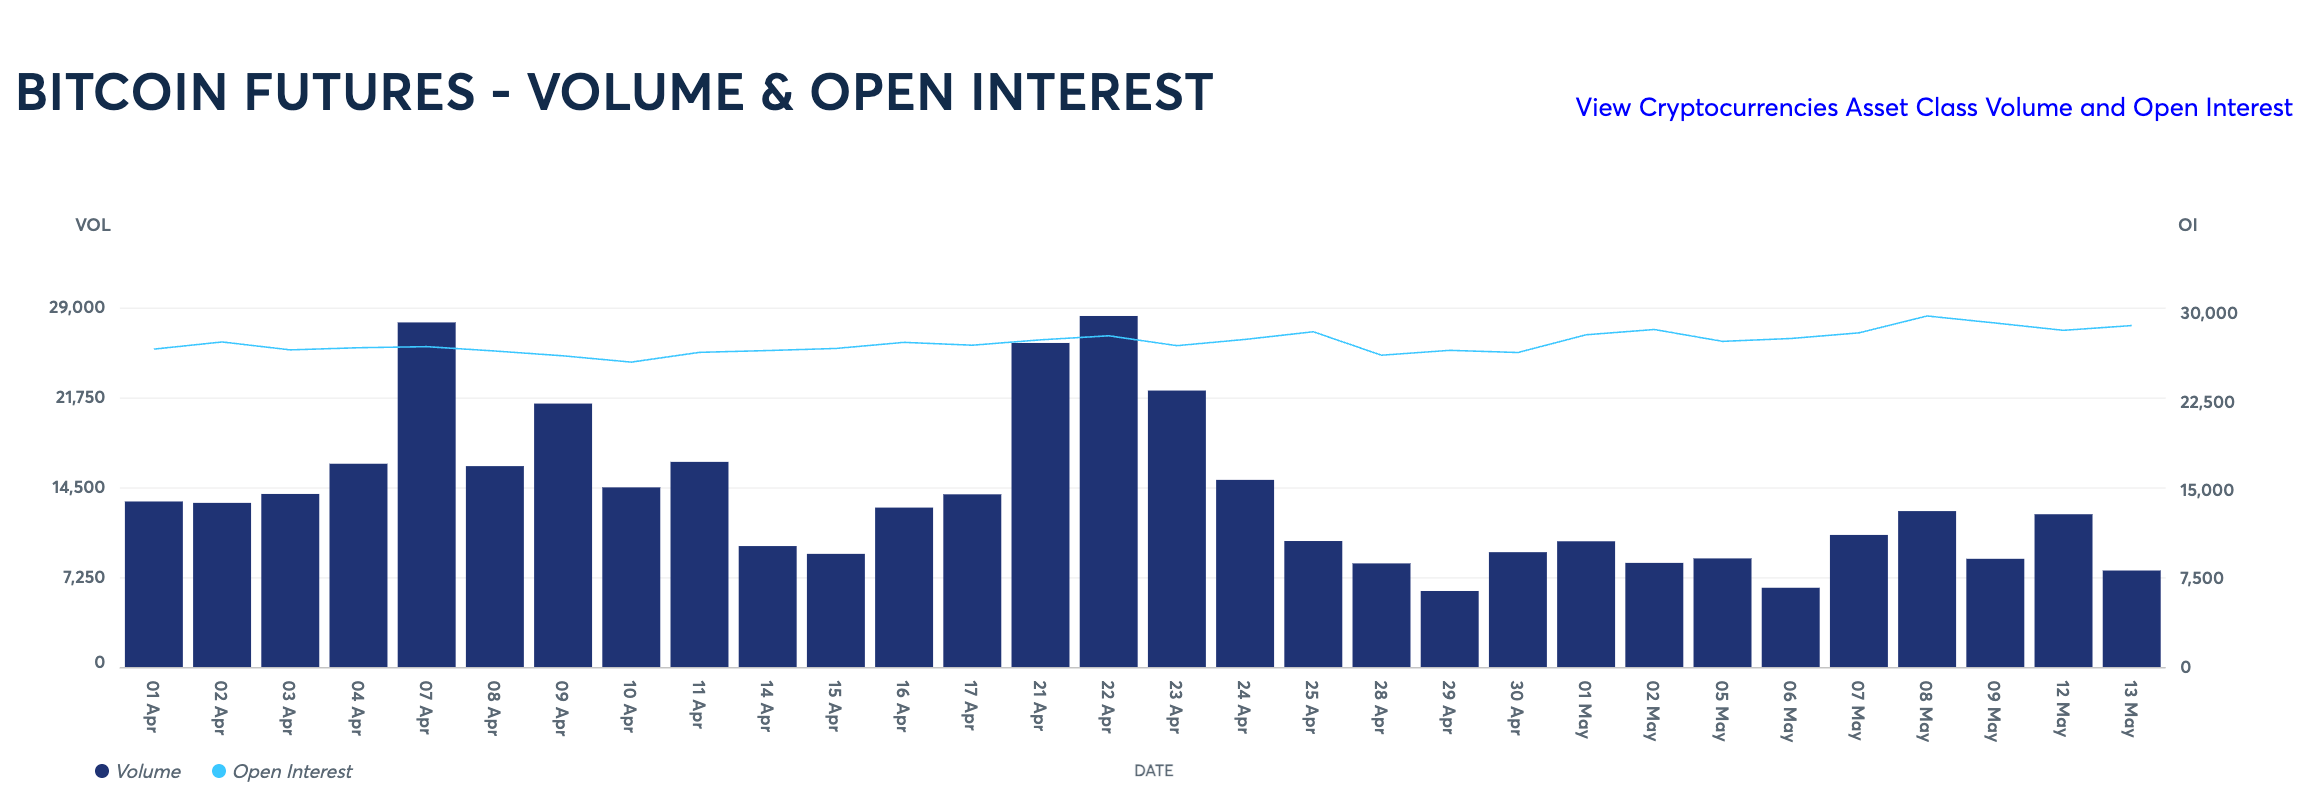
This, coupled with trading volumes that are lower compared to the initial move above $100K, suggests that the momentum of this swing higher is dwindling. Volumes are down across both crypto and institutional venues, with volume on CME BTC futures failing to surpass 35,000 contracts during three of the previous four weeks. The initial move saw volumes regularly exceed 65,000 contracts, hitting more than 85,000 on three occasions. One contract on the CME is worth 5 bitcoin ($514,000).
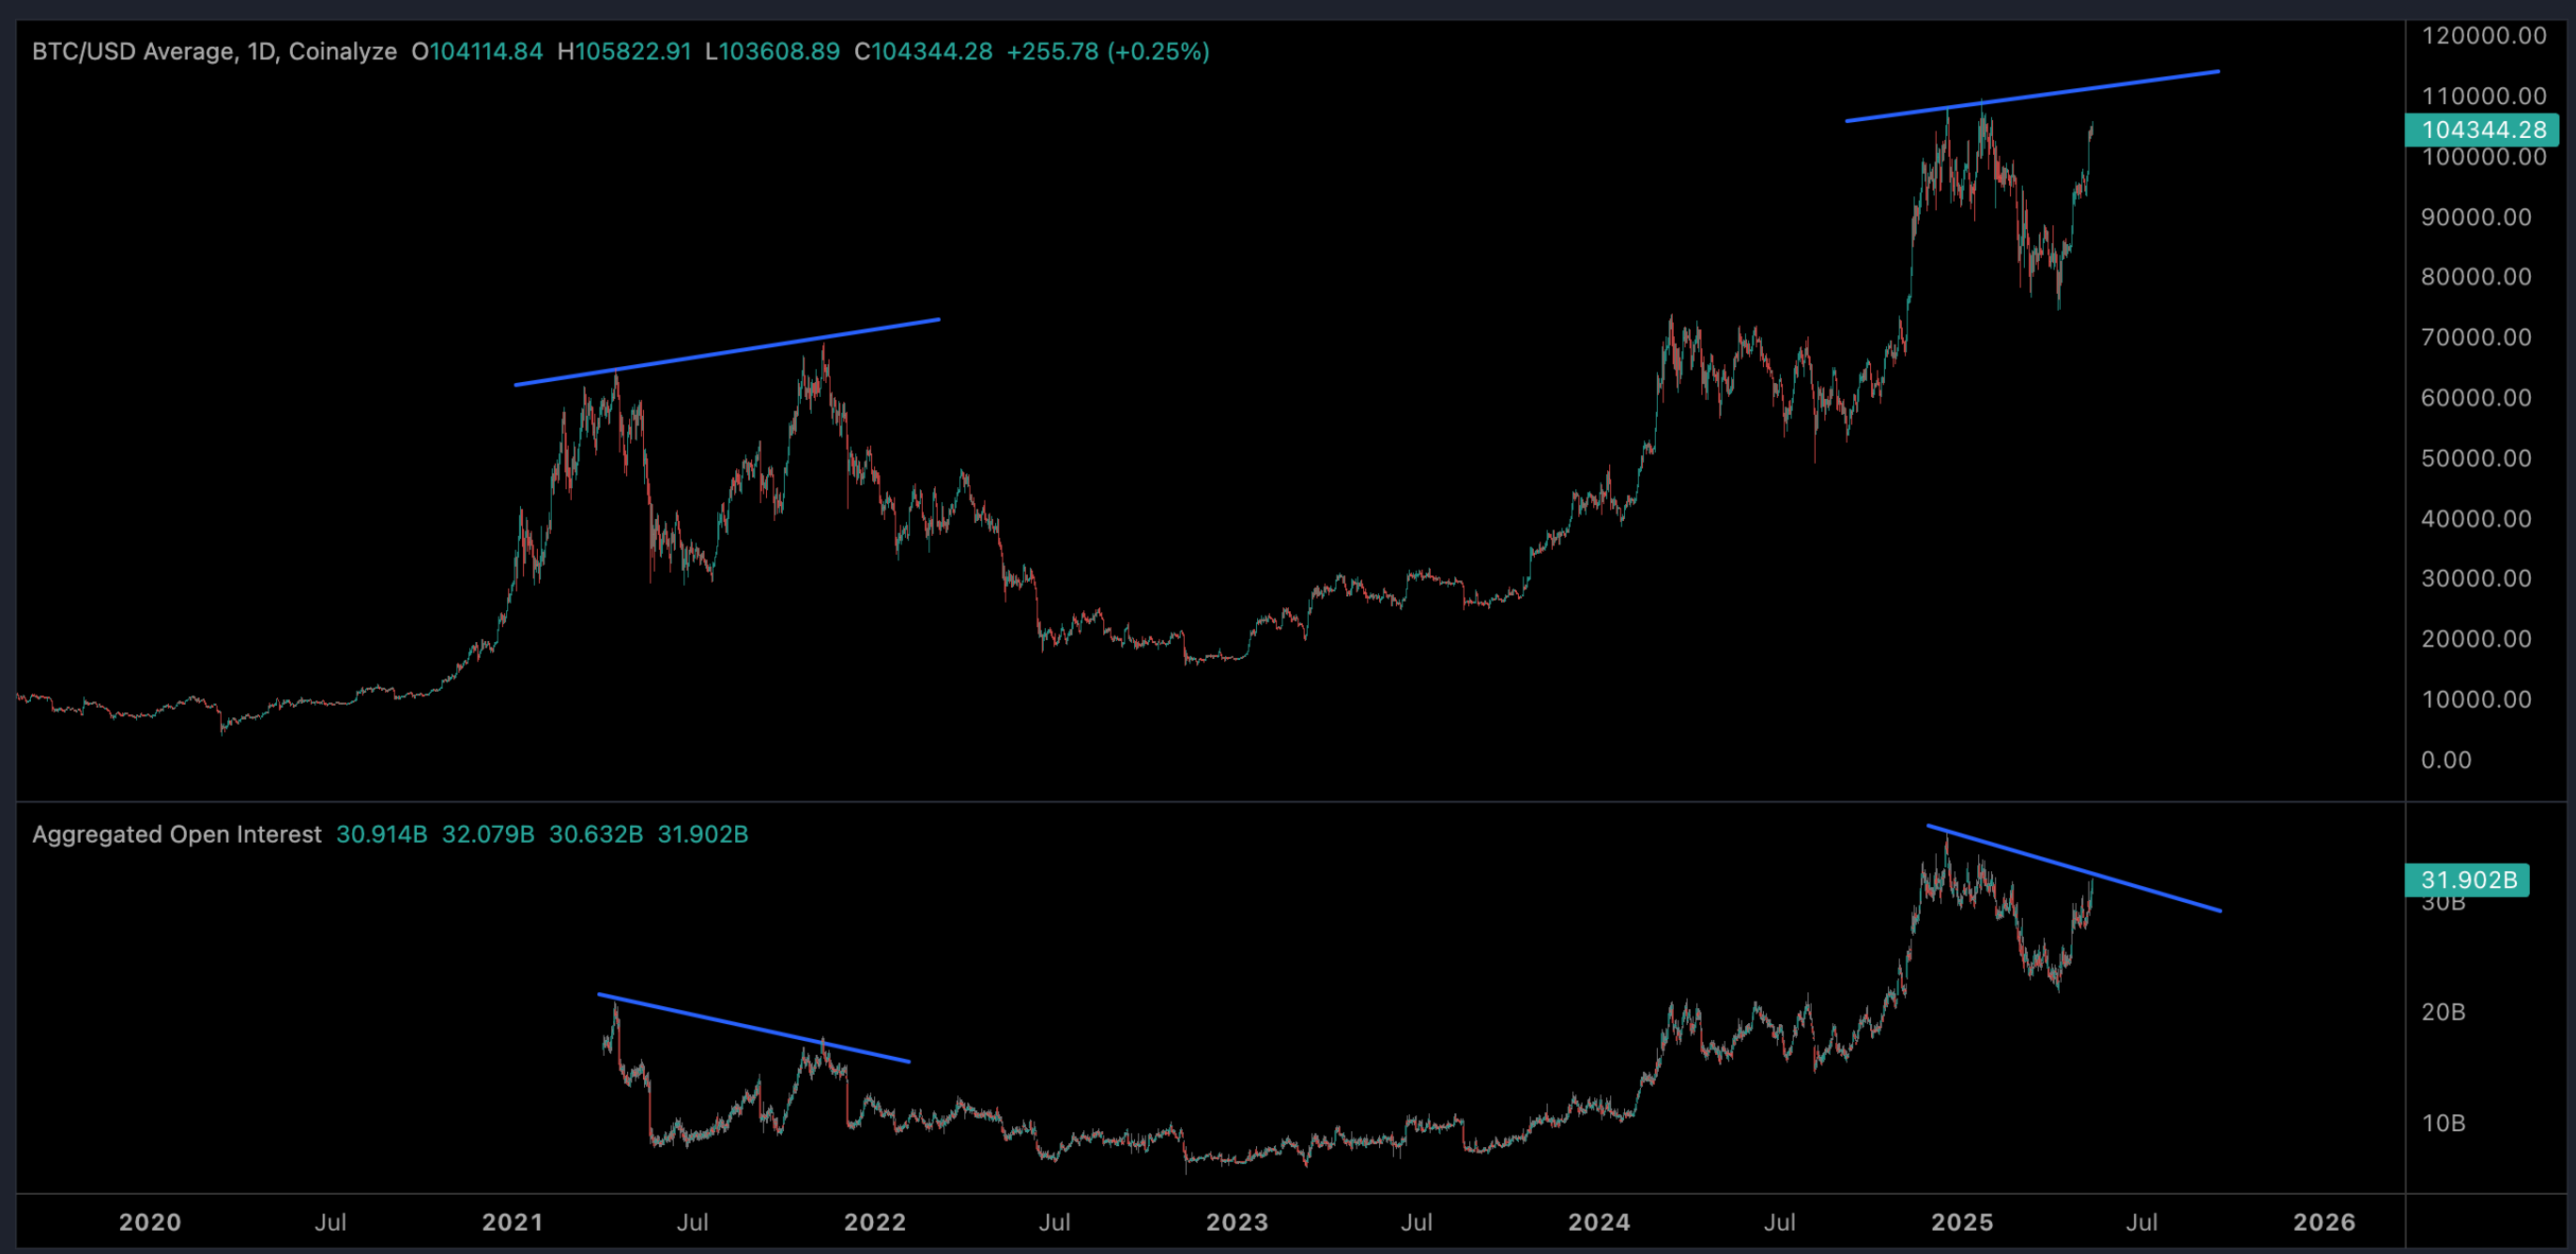
Like in 2021, open interest is also diverging from price action, currently Open interest 13% lower than the initial drive to $109K in January while price is just 5.8% lower. Four years ago when bitcoin hit $69,000, open interest was 15.6% lower than the initial $65,000 high despite the price being 6.6% higher.
What does this mean?
The similarities with 2021 are clear but it’s worth noting that the crypto market structure is entirely different than four years ago. Mostly thanks to Michael Saylor’s Strategy and a growing number of corporate copycats ramping up BTC acquisitions at any cost, the presence of institutional interest is far higher in this cycle. There is also the element of spot bitcoin ETFs, which allows intuitional investors and companies to acquire BTC in a traditional regulated venue.
As learned in 2021, on-chain metrics can be an inaccurate measure of forecasting price action. It is feasible that BTC breaks a new record high after TRUMP inevitably reveals details of a U.S. bitcoin treasury, but that could also become a “sell the news event,” in which traders attempt to capitalize on emotional buying from uninformed retail investors.
What the indicators do suggest is that whilst a new record high could be formed like in 2021, the momentum of this MOVE is waning and analysts who are boldly calling for $150K or even $200K price targets could be in for a rude awakening once the sell-off truly begins. Bitcoin entered more than a one-year bear market at the end of 2021, resulting in substantial layoffs across the industry and the implosion of several trading firms, centralized lending companies and DeFi protocols.
This time around, the market has several other elements to consider if prices begin to tumble. Notably, MSTR’s Leveraged BTC position, the emerging BTC DeFi industry that has $6.3 billon in total value locked (TVL), and the billions of frothy dollars that bounce around the memecoin ecosystem, which is known to disproportionately contract during times of market pressure

Log in to Reply
Log in to comment your thoughtsComments
Related Articles
|Square
Get the BTCC app to start your crypto journey
Get started today Scan to join our 100M+ users