Bitcoin’s Next Mega Rally? Two Chart Patterns Point to $109K—Again

Bitcoin’s price action is flashing eerily familiar signals—and they’re screaming ’bull run.’
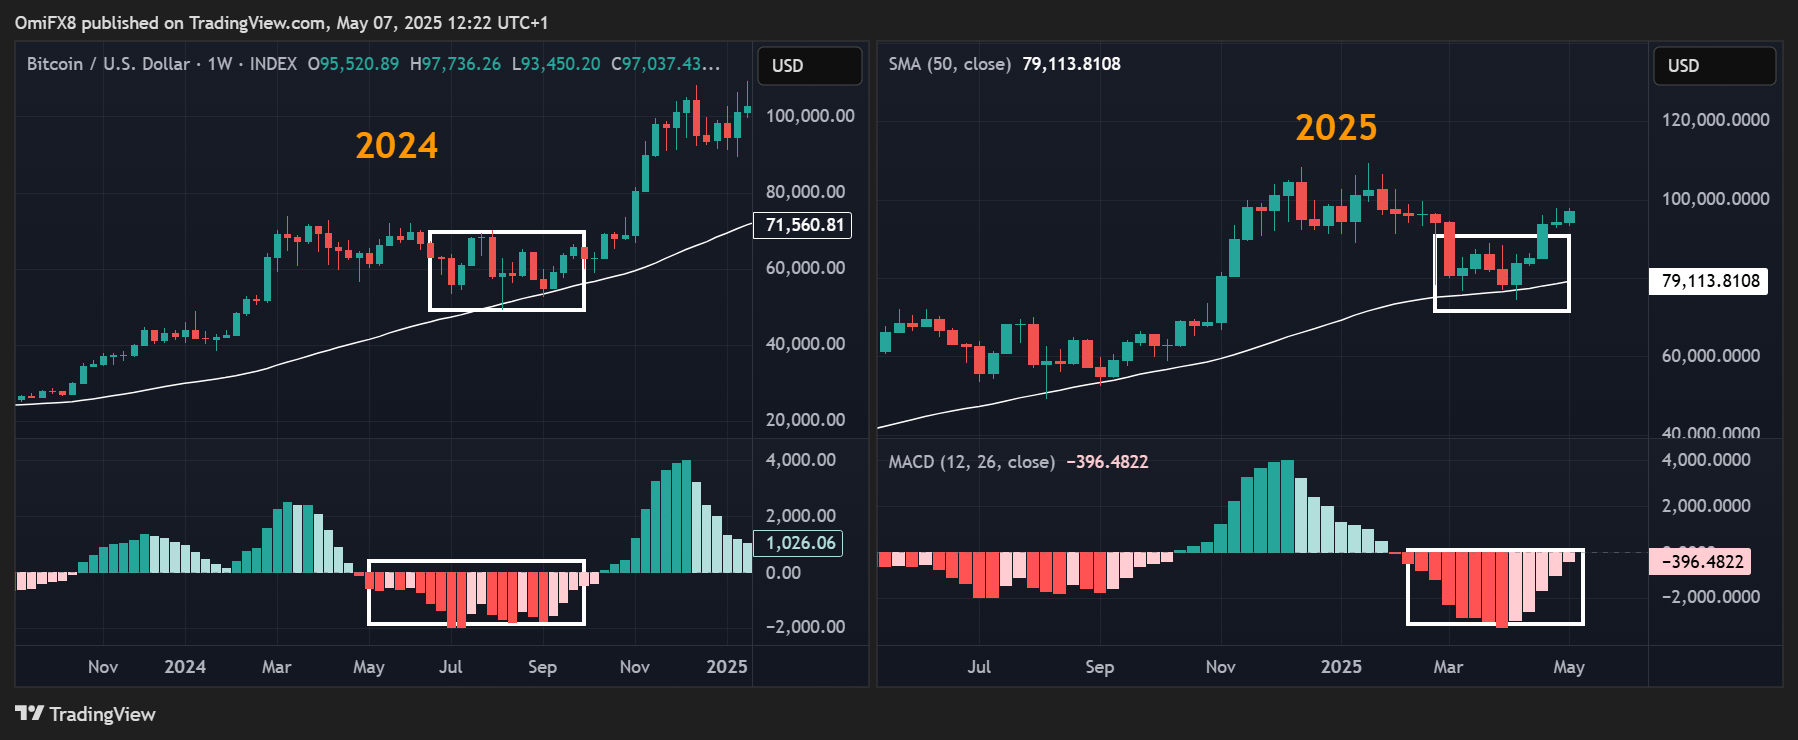
Two key technical patterns—mirroring the 2021 surge—suggest BTC could be gearing up for a replay. The last time this happened? A 5x climb to its all-time high. Now, history might be rhyming hard.
But before you YOLO your life savings: Wall Street’s still betting against crypto between martini lunches. Stay sharp.
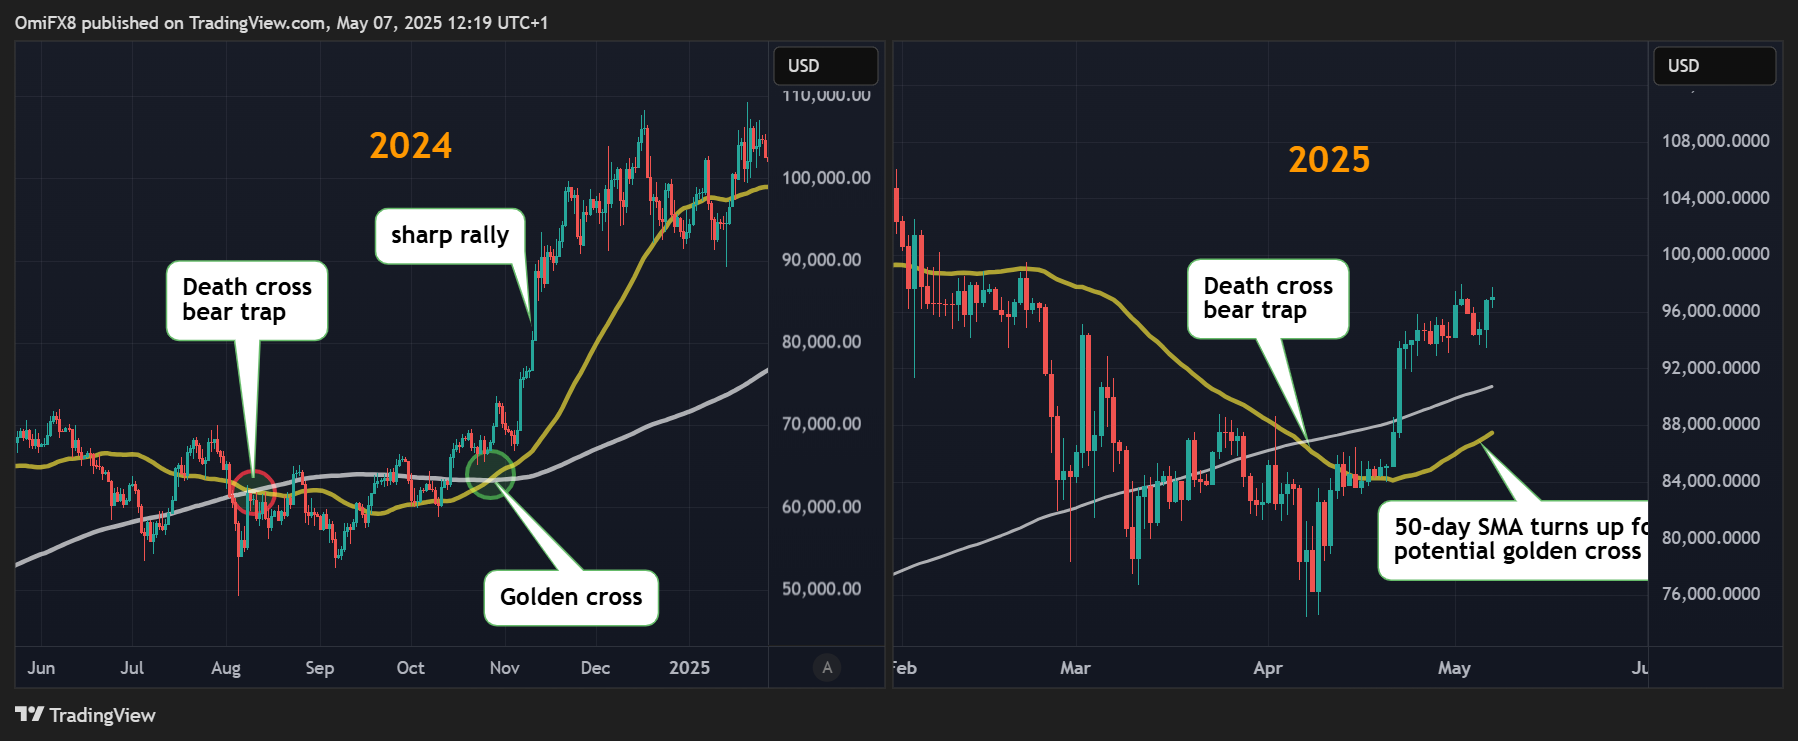
The second pattern involves the 50- and 200-day SMAs. About four weeks ago, these averages formed a bearish crossover—commonly known as the death cross—signaling a potential long-term downtrend. However, this turned out to be a bear trap, with Bitcoin finding support around $75K and reversing course.
Recently, the 50-day SMA has begun to rise again and could soon cross above the 200-day SMA, setting up a bullish golden cross in the coming weeks.
This pattern closely mirrors last year’s trend: the death cross in August marked a bottom, quickly followed by a golden cross that sparked a breakout above $70K and ultimately led to a rally above $109K to new highs.
In other words, bullish volatility could be on the horizon, potentially taking bitcoin well past the January high of $109K.
Chart patterns are commonly used to assess market strength and forecast future movements. However, it’s important to remember that history doesn’t always repeat itself, and macroeconomic factors can rapidly swing market directions, making chart analysis far from foolproof.