Bitcoin’s Bullish Rebound Clashes With Bearish MA Setup As Key ETFs Flash Risk-Off Signals

Bitcoin's latest price surge just hit a technical wall—and the charts are telling a dangerous story.
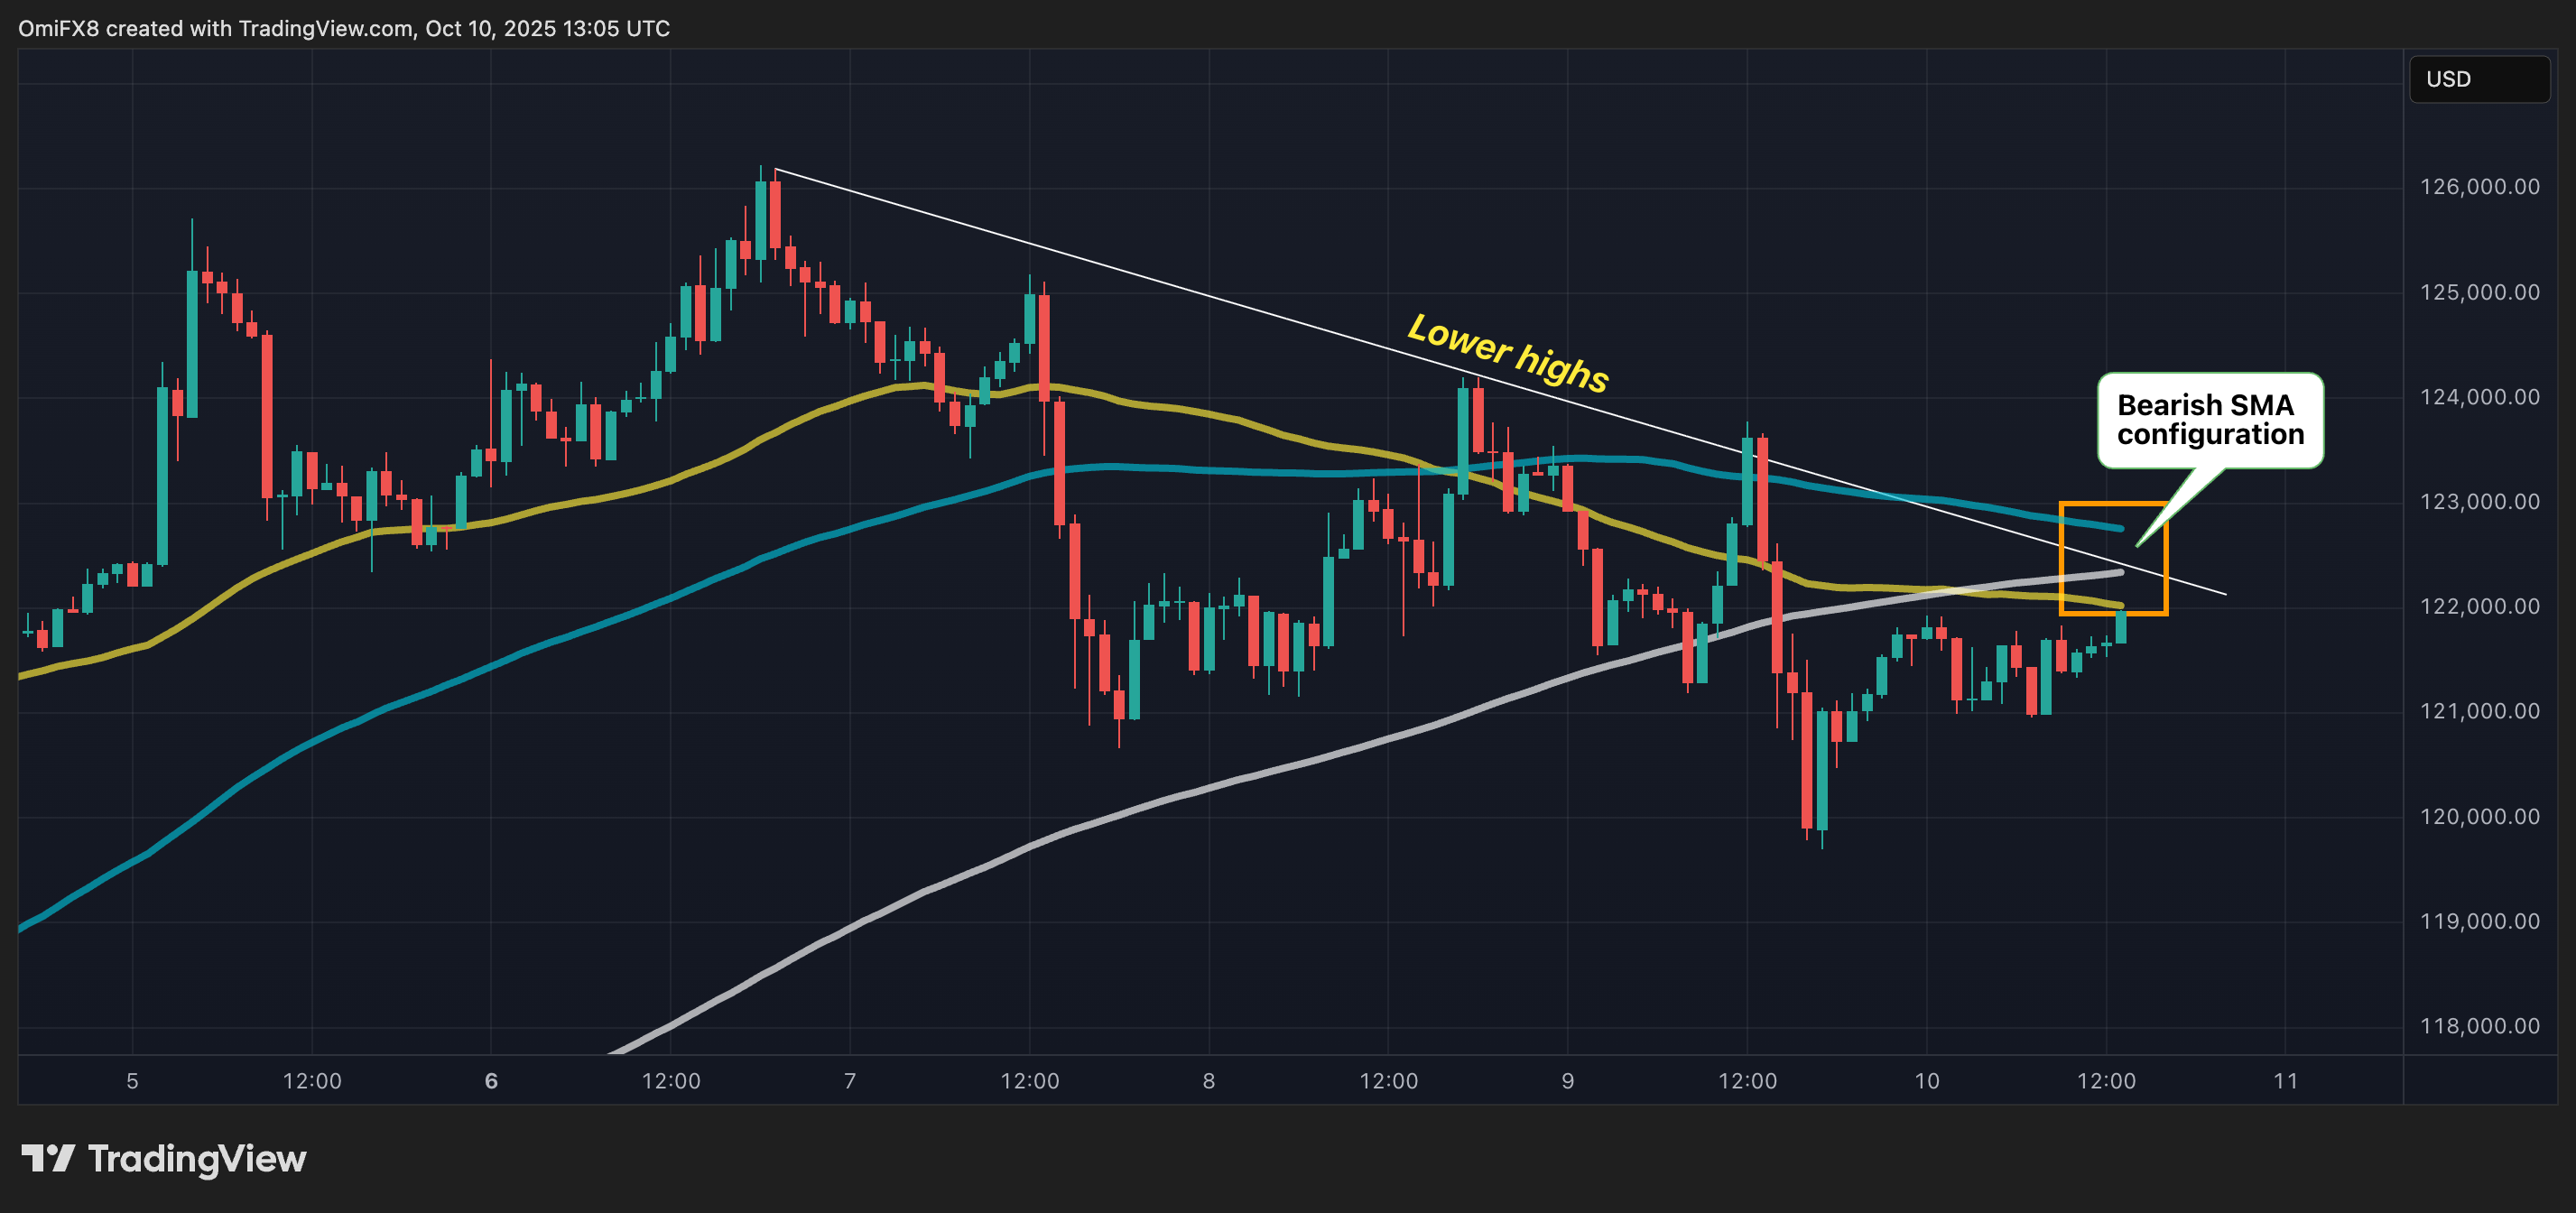
The Moving Average Configuration Conundrum
While BTC showed impressive upward momentum this week, the underlying moving average structure paints a bearish picture that's making traders nervous. The classic technical indicators that typically signal sustained rallies are flashing warning signs instead of confirmation.
ETF Outflows Tell the Real Story
Major cryptocurrency ETFs are seeing money walk out the door despite the price bounce—because smart money knows that when the technicals and fundamentals disagree, the technicals usually win. It's the financial equivalent of a restaurant with great reviews but empty tables.
This divergence between price action and institutional sentiment creates a classic 'trust but verify' moment for crypto investors. The bounce looks good on paper, but the market's risk-off posture suggests this might be another fakeout in the making.
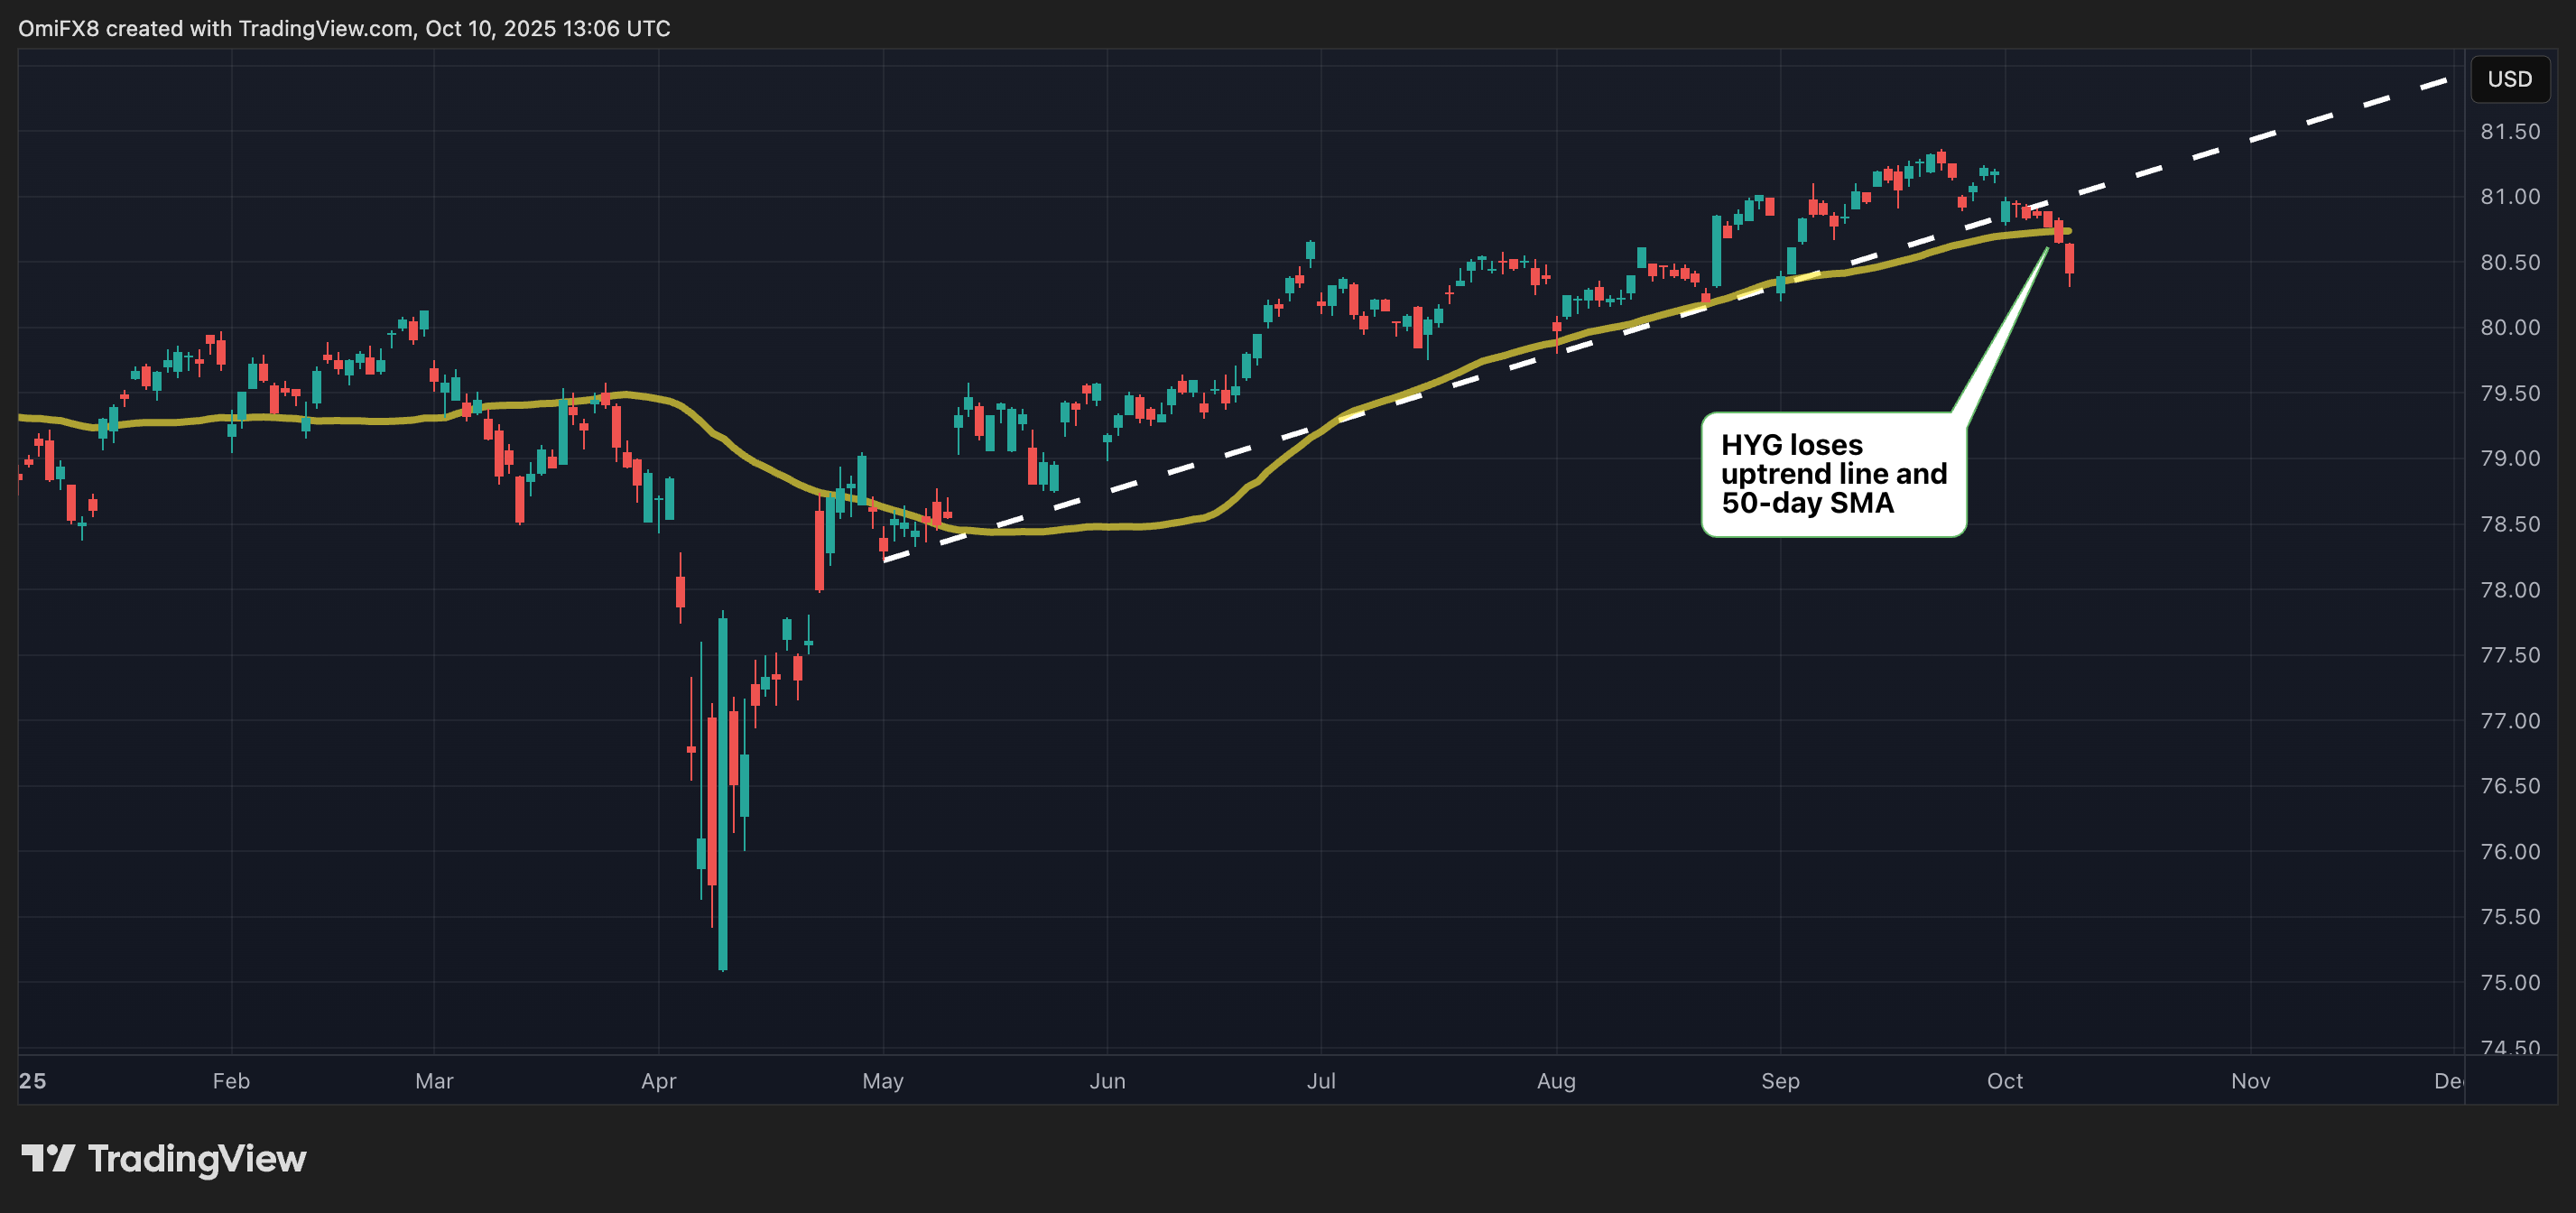
Second, key ETFs are signaling a risk-off sentiment.
The iShares iBoxx High Yield Corporate Bond ETF (HYG) has broken below its bullish trendline from May lows and slipped beneath its 50-day SMA for the first time in six months.
As HYG holds high-yield ("junk") corporate bonds, a downtrend here typically reflects rising investor aversion to risk, with investors moving away from riskier, lower-rated bonds.
While BTC is often called digital gold, it has historically correlated with stocks, reflecting broader market risk sentiment.
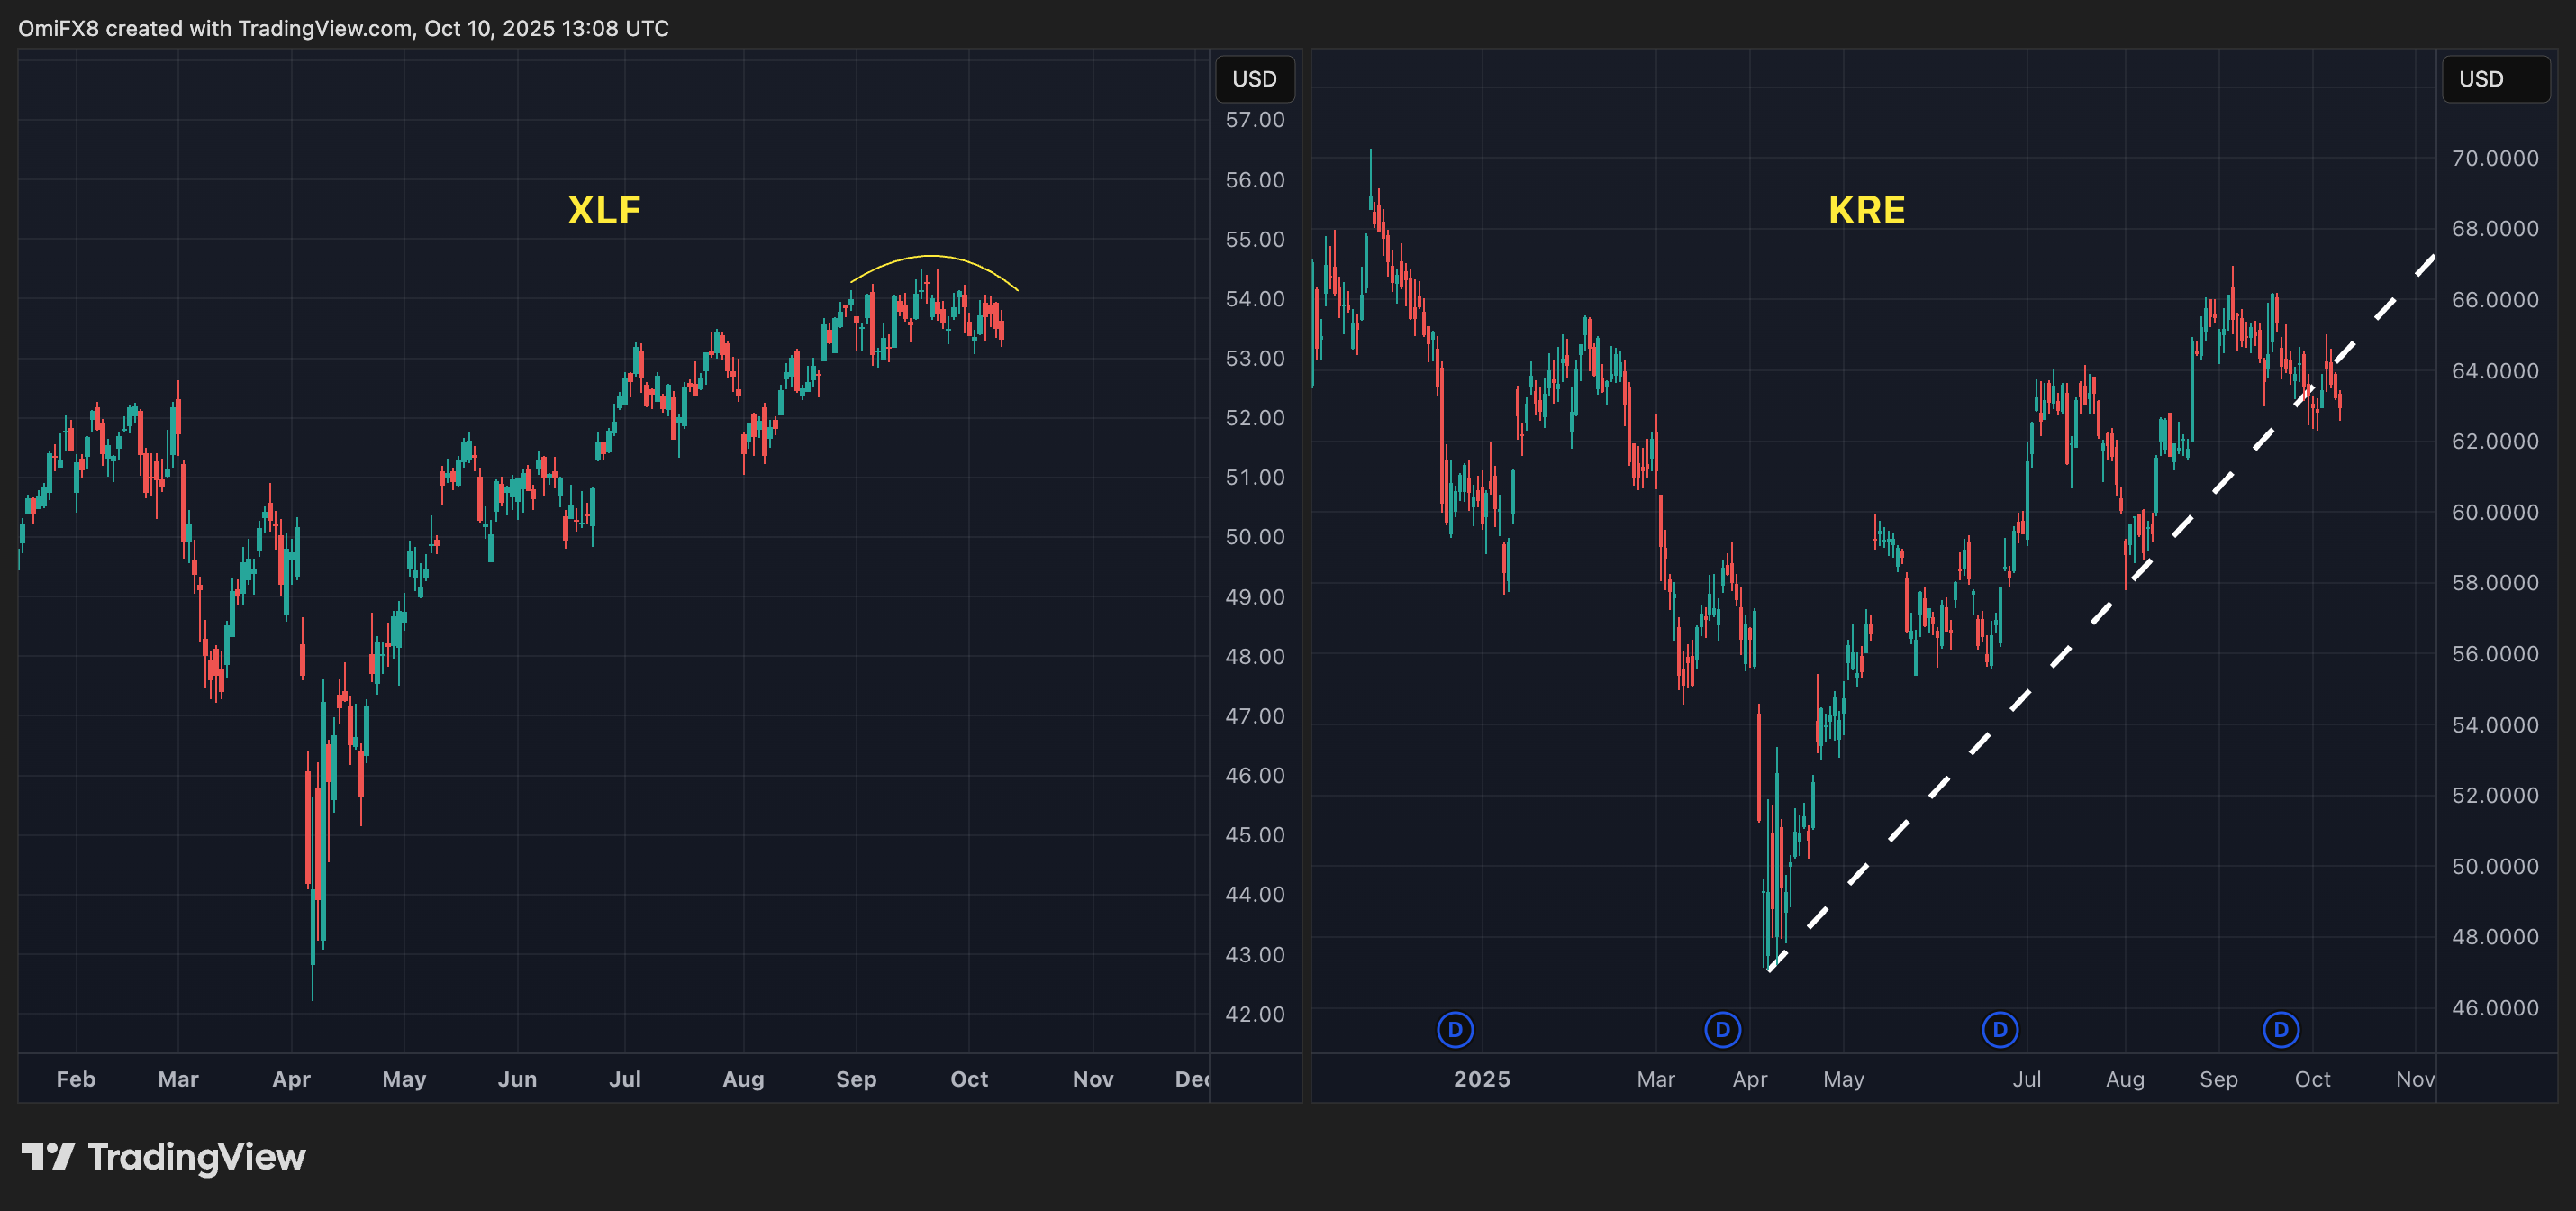
Meanwhile, in the financial sector, the Financial Select Sector SPDR Fund (XLF), which tracks major banking stocks, has lost momentum since late August and appears to be forming a rounding-top pattern suggestive of a bear market. Similarly, the regional banking ETF (KRE) has also broken below its bullish trendline established since April.
Key levels
BTC's bearish technical setup on short duration charts, coupled with caution in key bond and banking ETFs, indicate a market environment leaning towards risk aversion.
The immediate support for BTC is seen at $120,000 followed by $118,000. A move above $124,000 WOULD weaken the case for a deeper pullback.
