Bitcoin Faces Critical 2017-21 Trendline Test While SOL Flashes ’Shooting Star’ Warning Signal

Bitcoin's latest rally just hit a major historical resistance wall—the same trendline that defined its bull cycles since 2017. Meanwhile, Solana's chart paints a worrying picture with a classic 'shooting star' pattern that's got traders sweating.
Technical Tug-of-War
BTC's dance with this multi-year trendline separates the believers from the profit-takers. Break above? Rally continues. Reject? Prepare for another gut-wrenching pullback. SOL's warning sign comes just as the altcoin was gaining momentum—typical crypto timing that makes traditional analysts reach for the antacids.
Market Psychology at Play
These patterns aren't just lines on a chart—they're battlegrounds where greed and fear throw punches. Bitcoin's resilience against macro headwinds remains impressive, while SOL's potential reversal shows even the hottest altcoins aren't immune to gravity. Remember when technical analysis was considered voodoo? Now it moves billions in digital assets—though sometimes it still feels like reading tea leaves during a hurricane.
Whether these signals prove prophetic or just another false alarm, one thing's certain: crypto markets never let you get comfortable. Perfect timing for those who thrive on volatility—and another reason why Wall Street still thinks we're all mad.
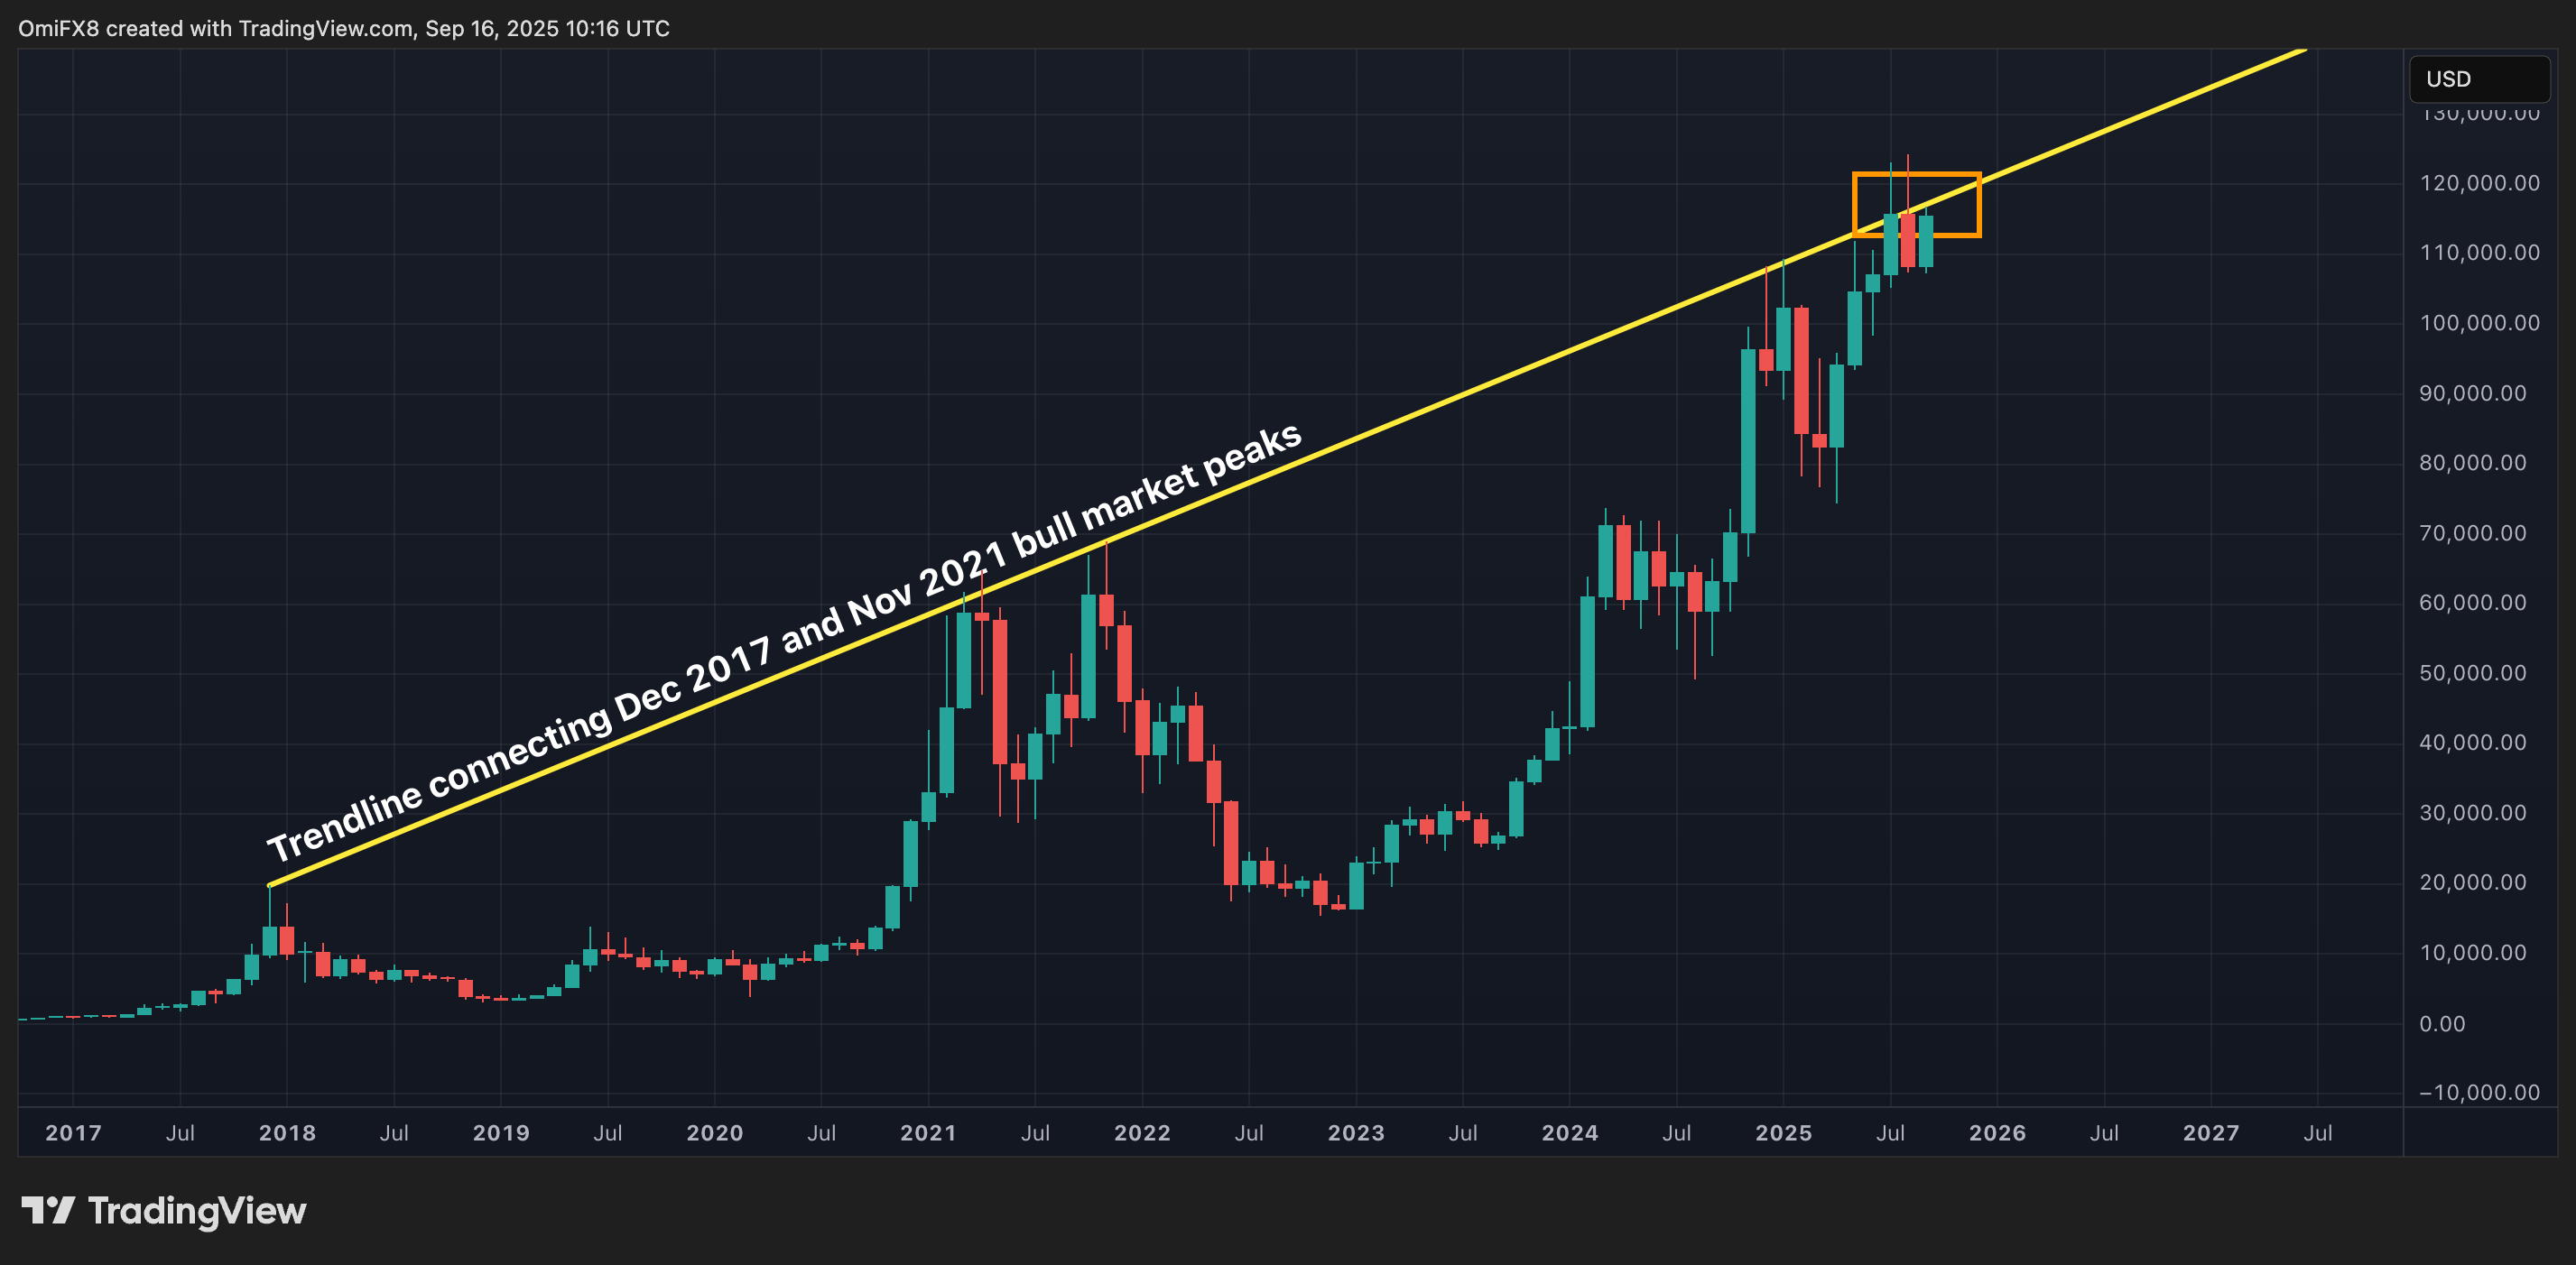
Can the bulls crack it on a third attempt? Possibly. Many analysts expect Bitcoin to continue grinding higher into year-end, buoyed by the widely anticipated Fed rate cut. But a third consecutive failure here would strengthen the bears’ hand, potentially fueling a deeper pullback.
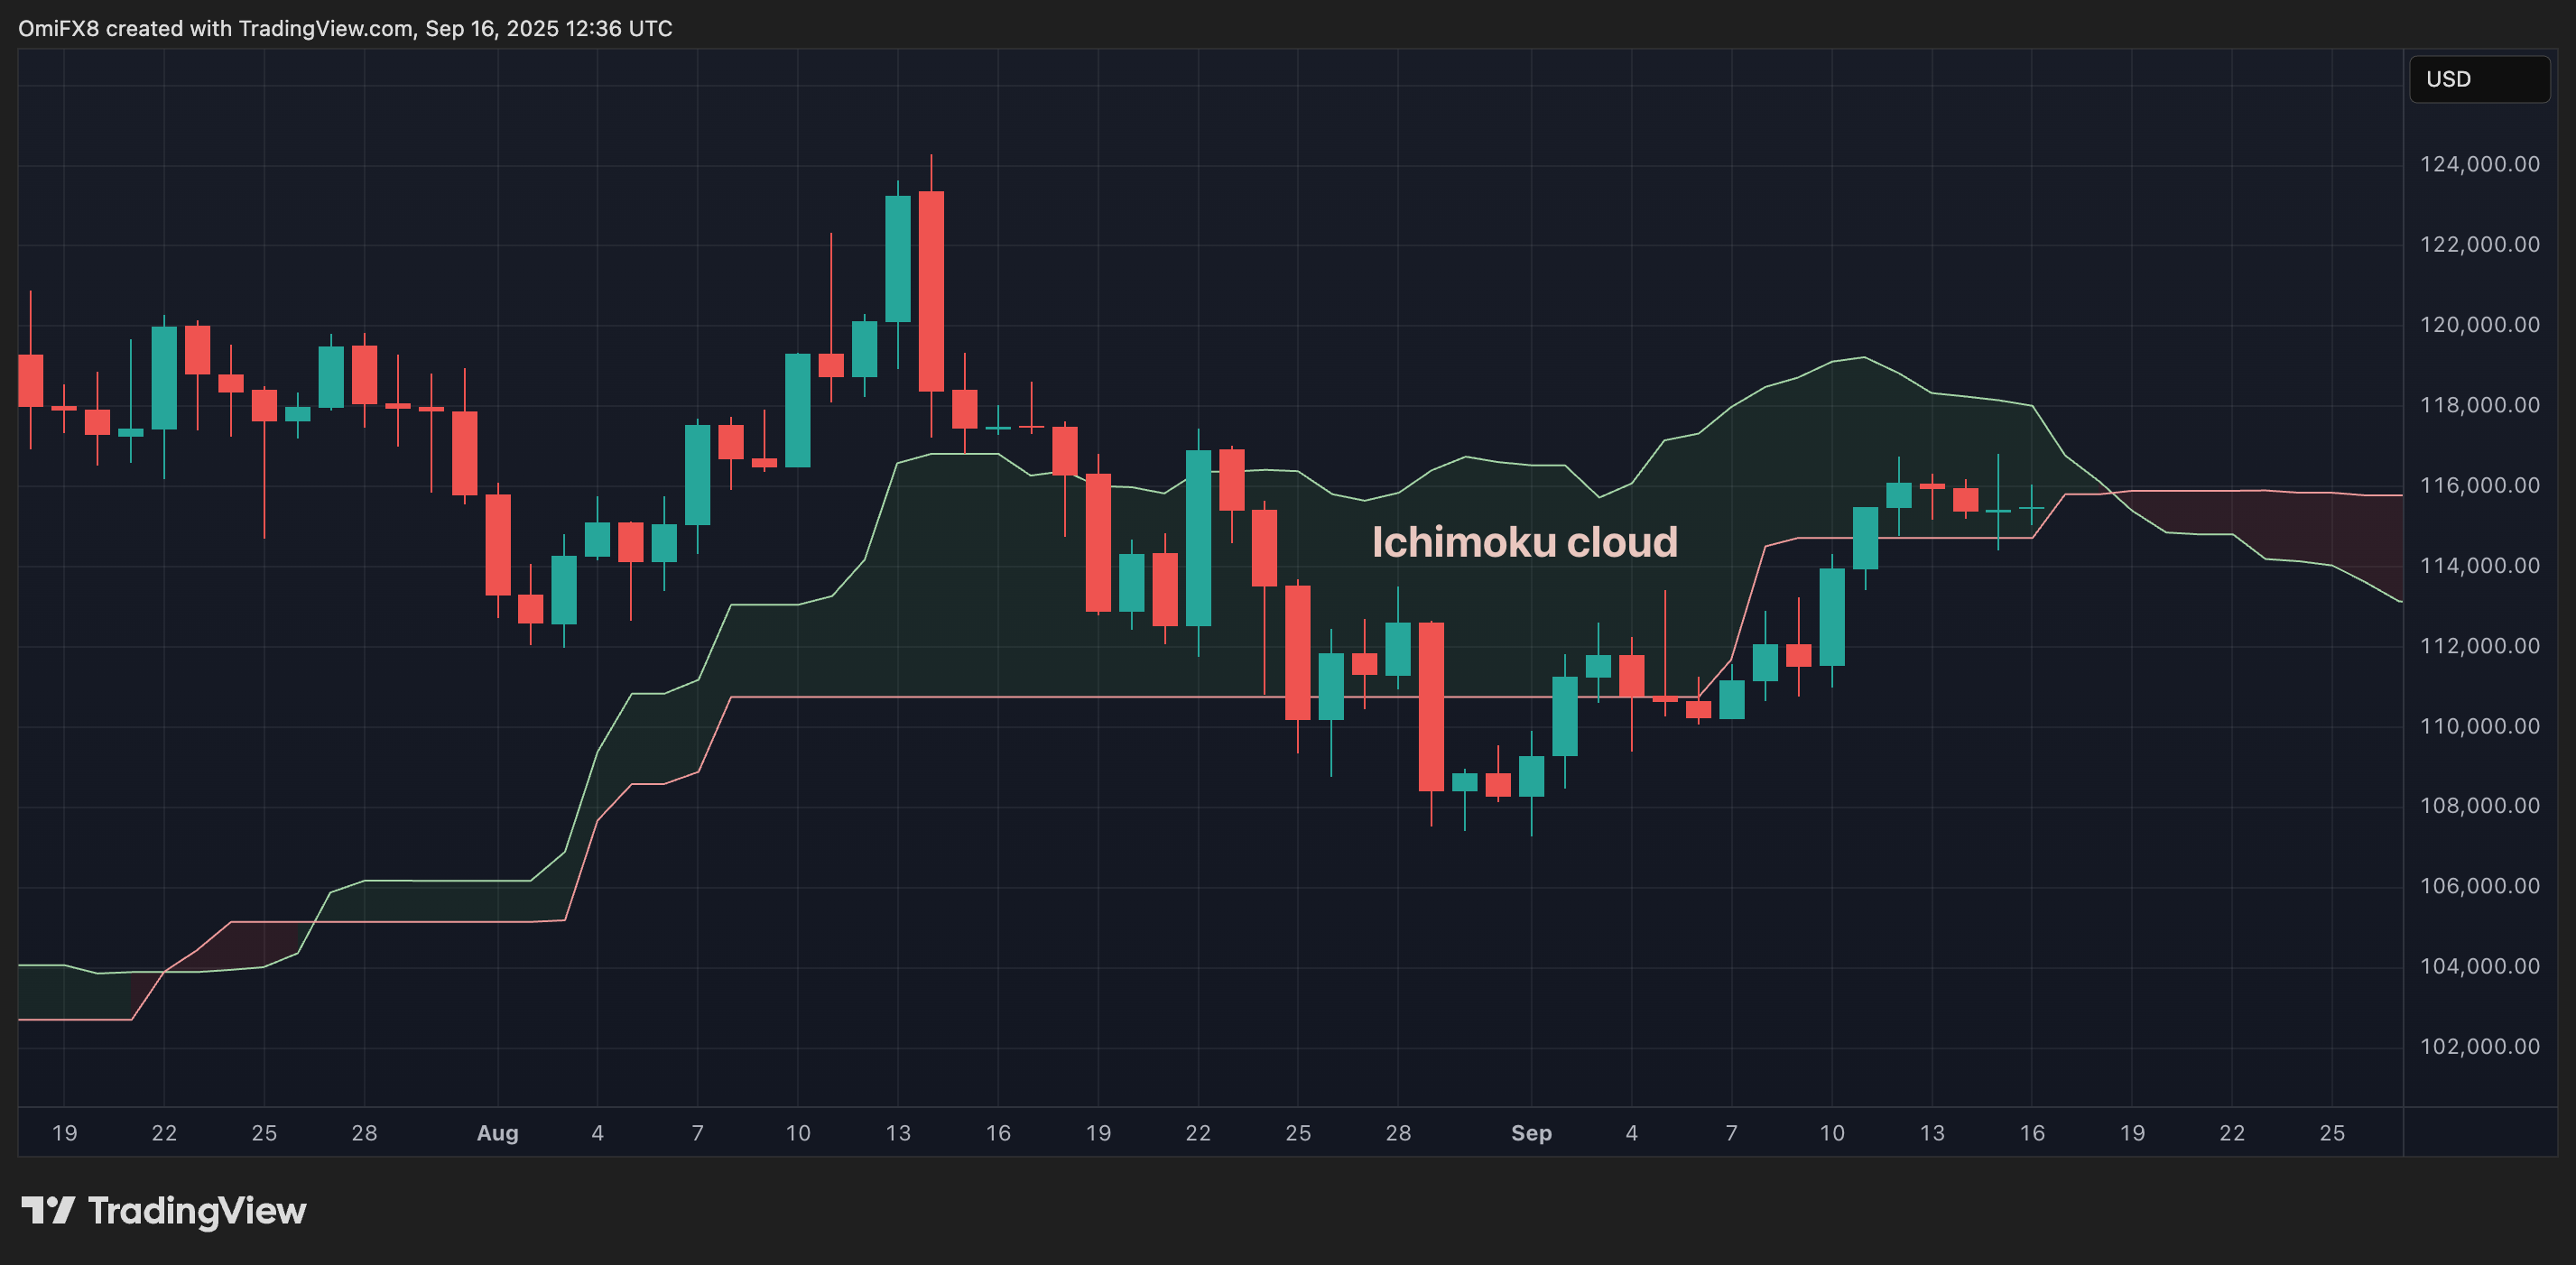
The first warning signs of a breakdown could emerge if daily prices slip below the Ichimoku cloud, currently acting as a zone of indecision. As of writing, bitcoin trades within that cloud, offering little directional clarity. Crosses above or below this cloud often signal shifts in momentum, so traders should watch carefully.
SOL’s ‘Shooting Star’ Warning
While enthusiasm around a solana's (SOL) price prospects remains high, the technicals suggest a note of caution. On Sunday, SOL formed a classic "shooting star" candlestick after hitting a multi-month high NEAR $250, only to pull back sharply by the close.
This pattern, a small real body with a long upper shadow after a protracted uptrend, as in SOL's case, signals that buyers pushed prices higher but ultimately lost control to sellers, who drove the price back down near the day’s low.
The bearish signal was confirmed when prices dipped further to about $230 on Monday, indicating a possible trend reversal.
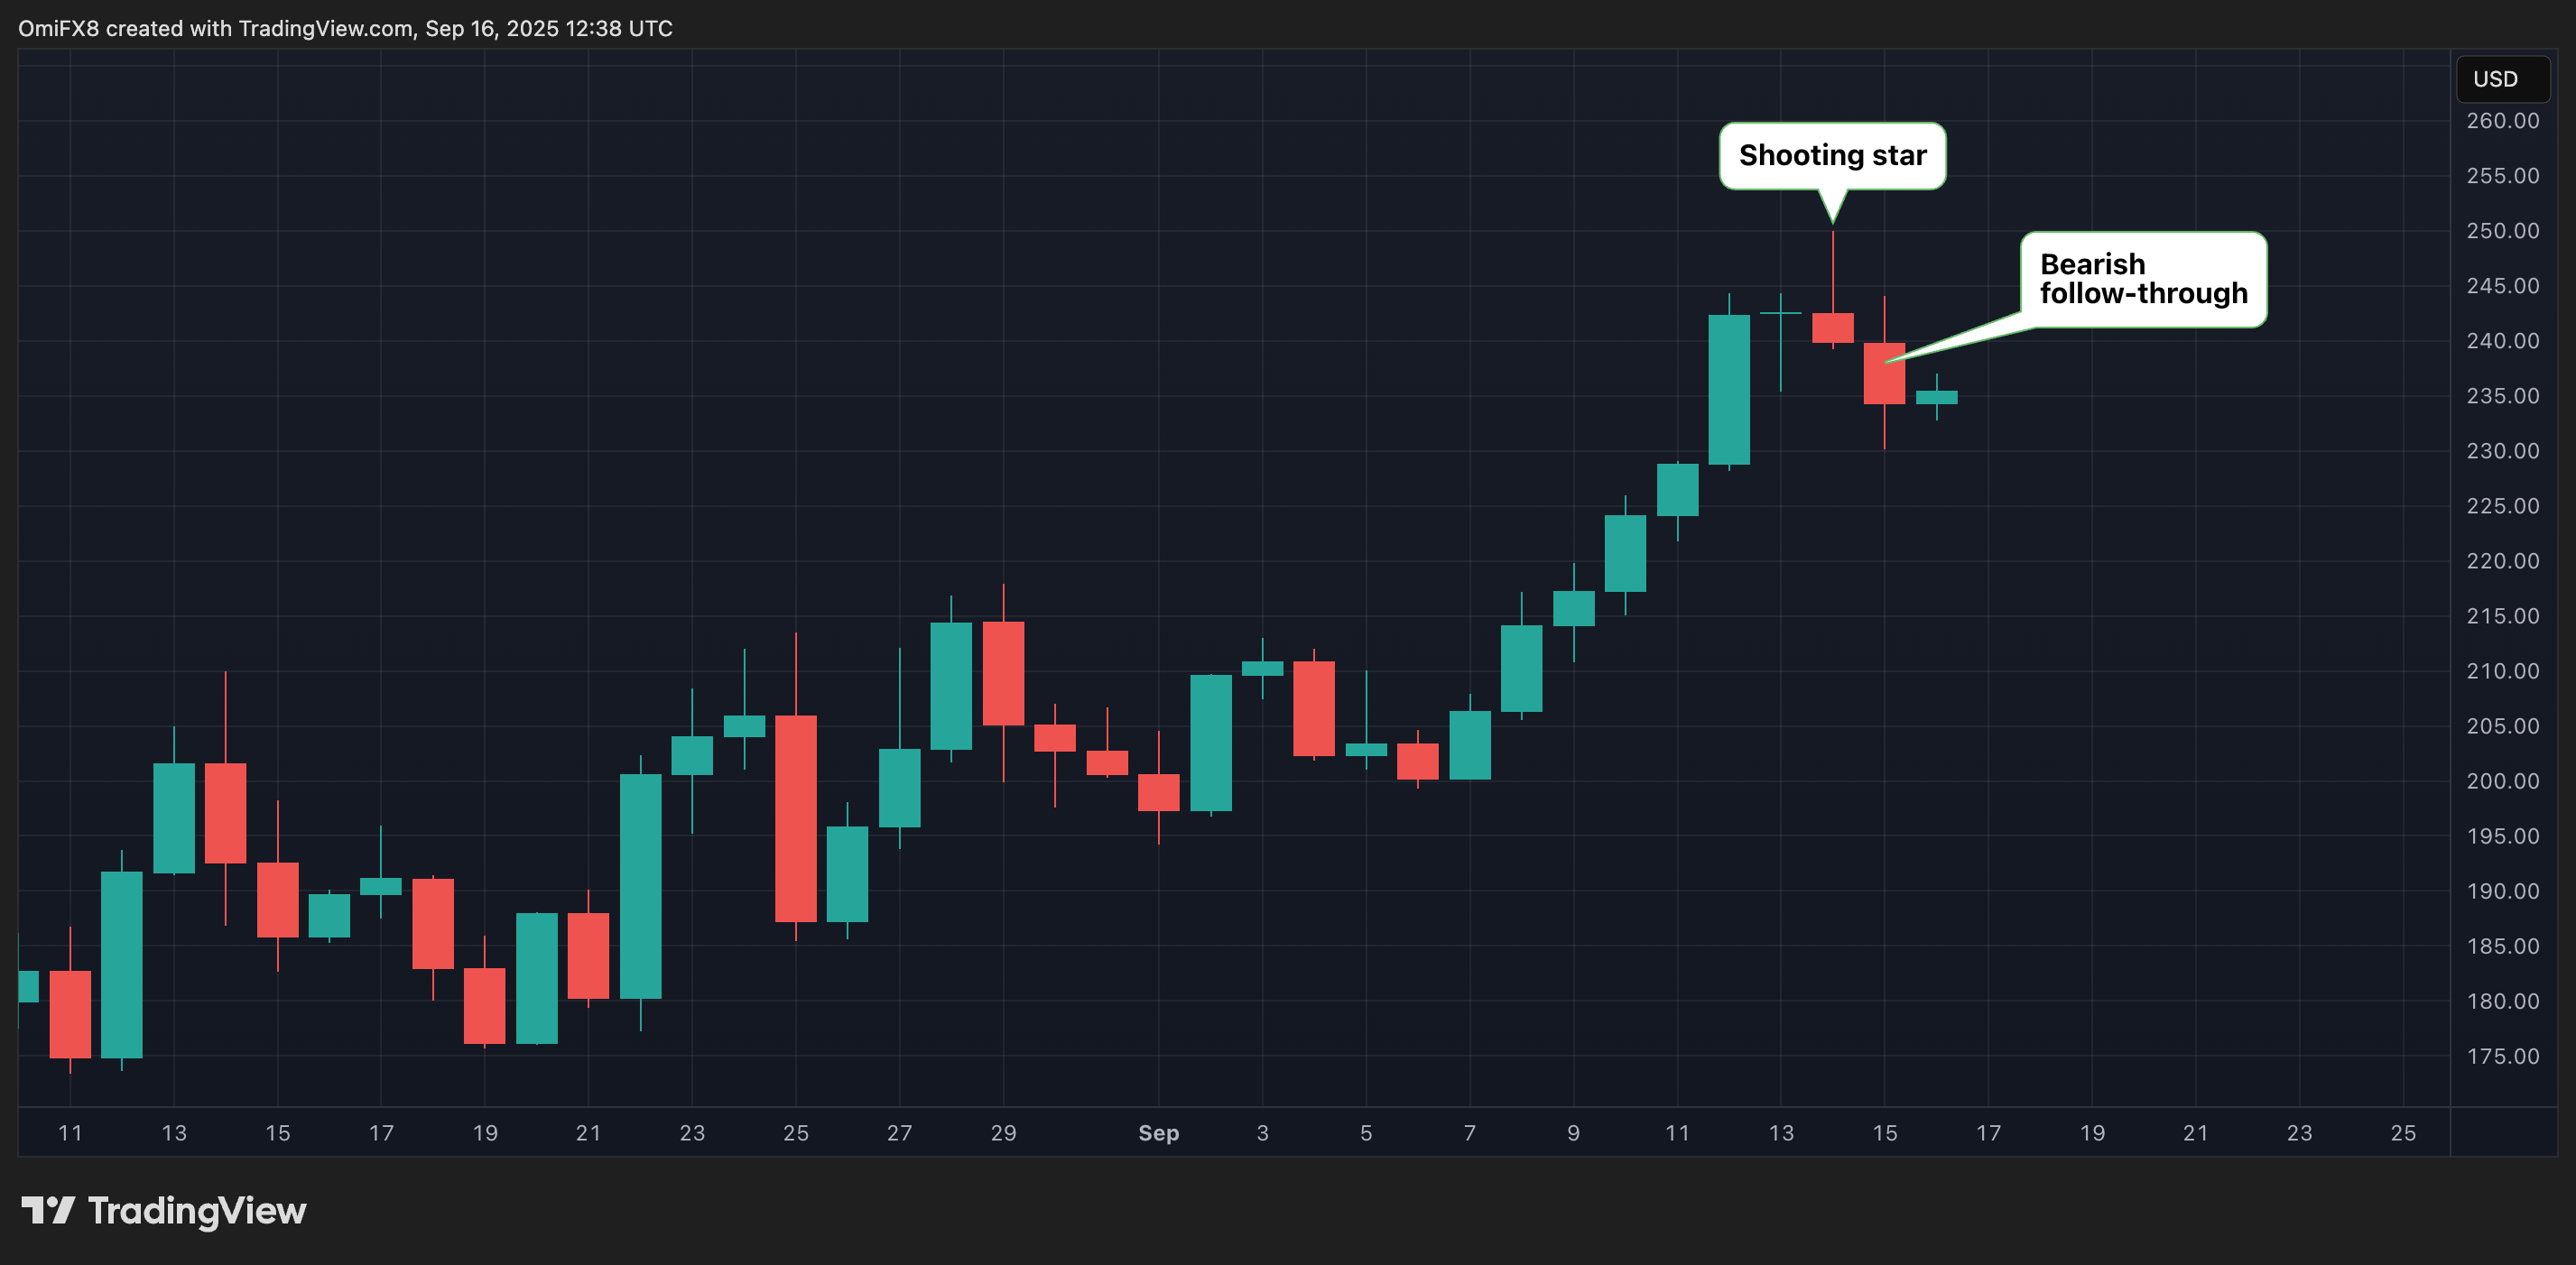
For bulls to regain control, SOL WOULD need to reclaim and hold above the $250 peak. Otherwise, the path looks toward a deeper decline, especially if the Fed’s upcoming decision disappoints markets by implying a more hawkish stance over the coming months.
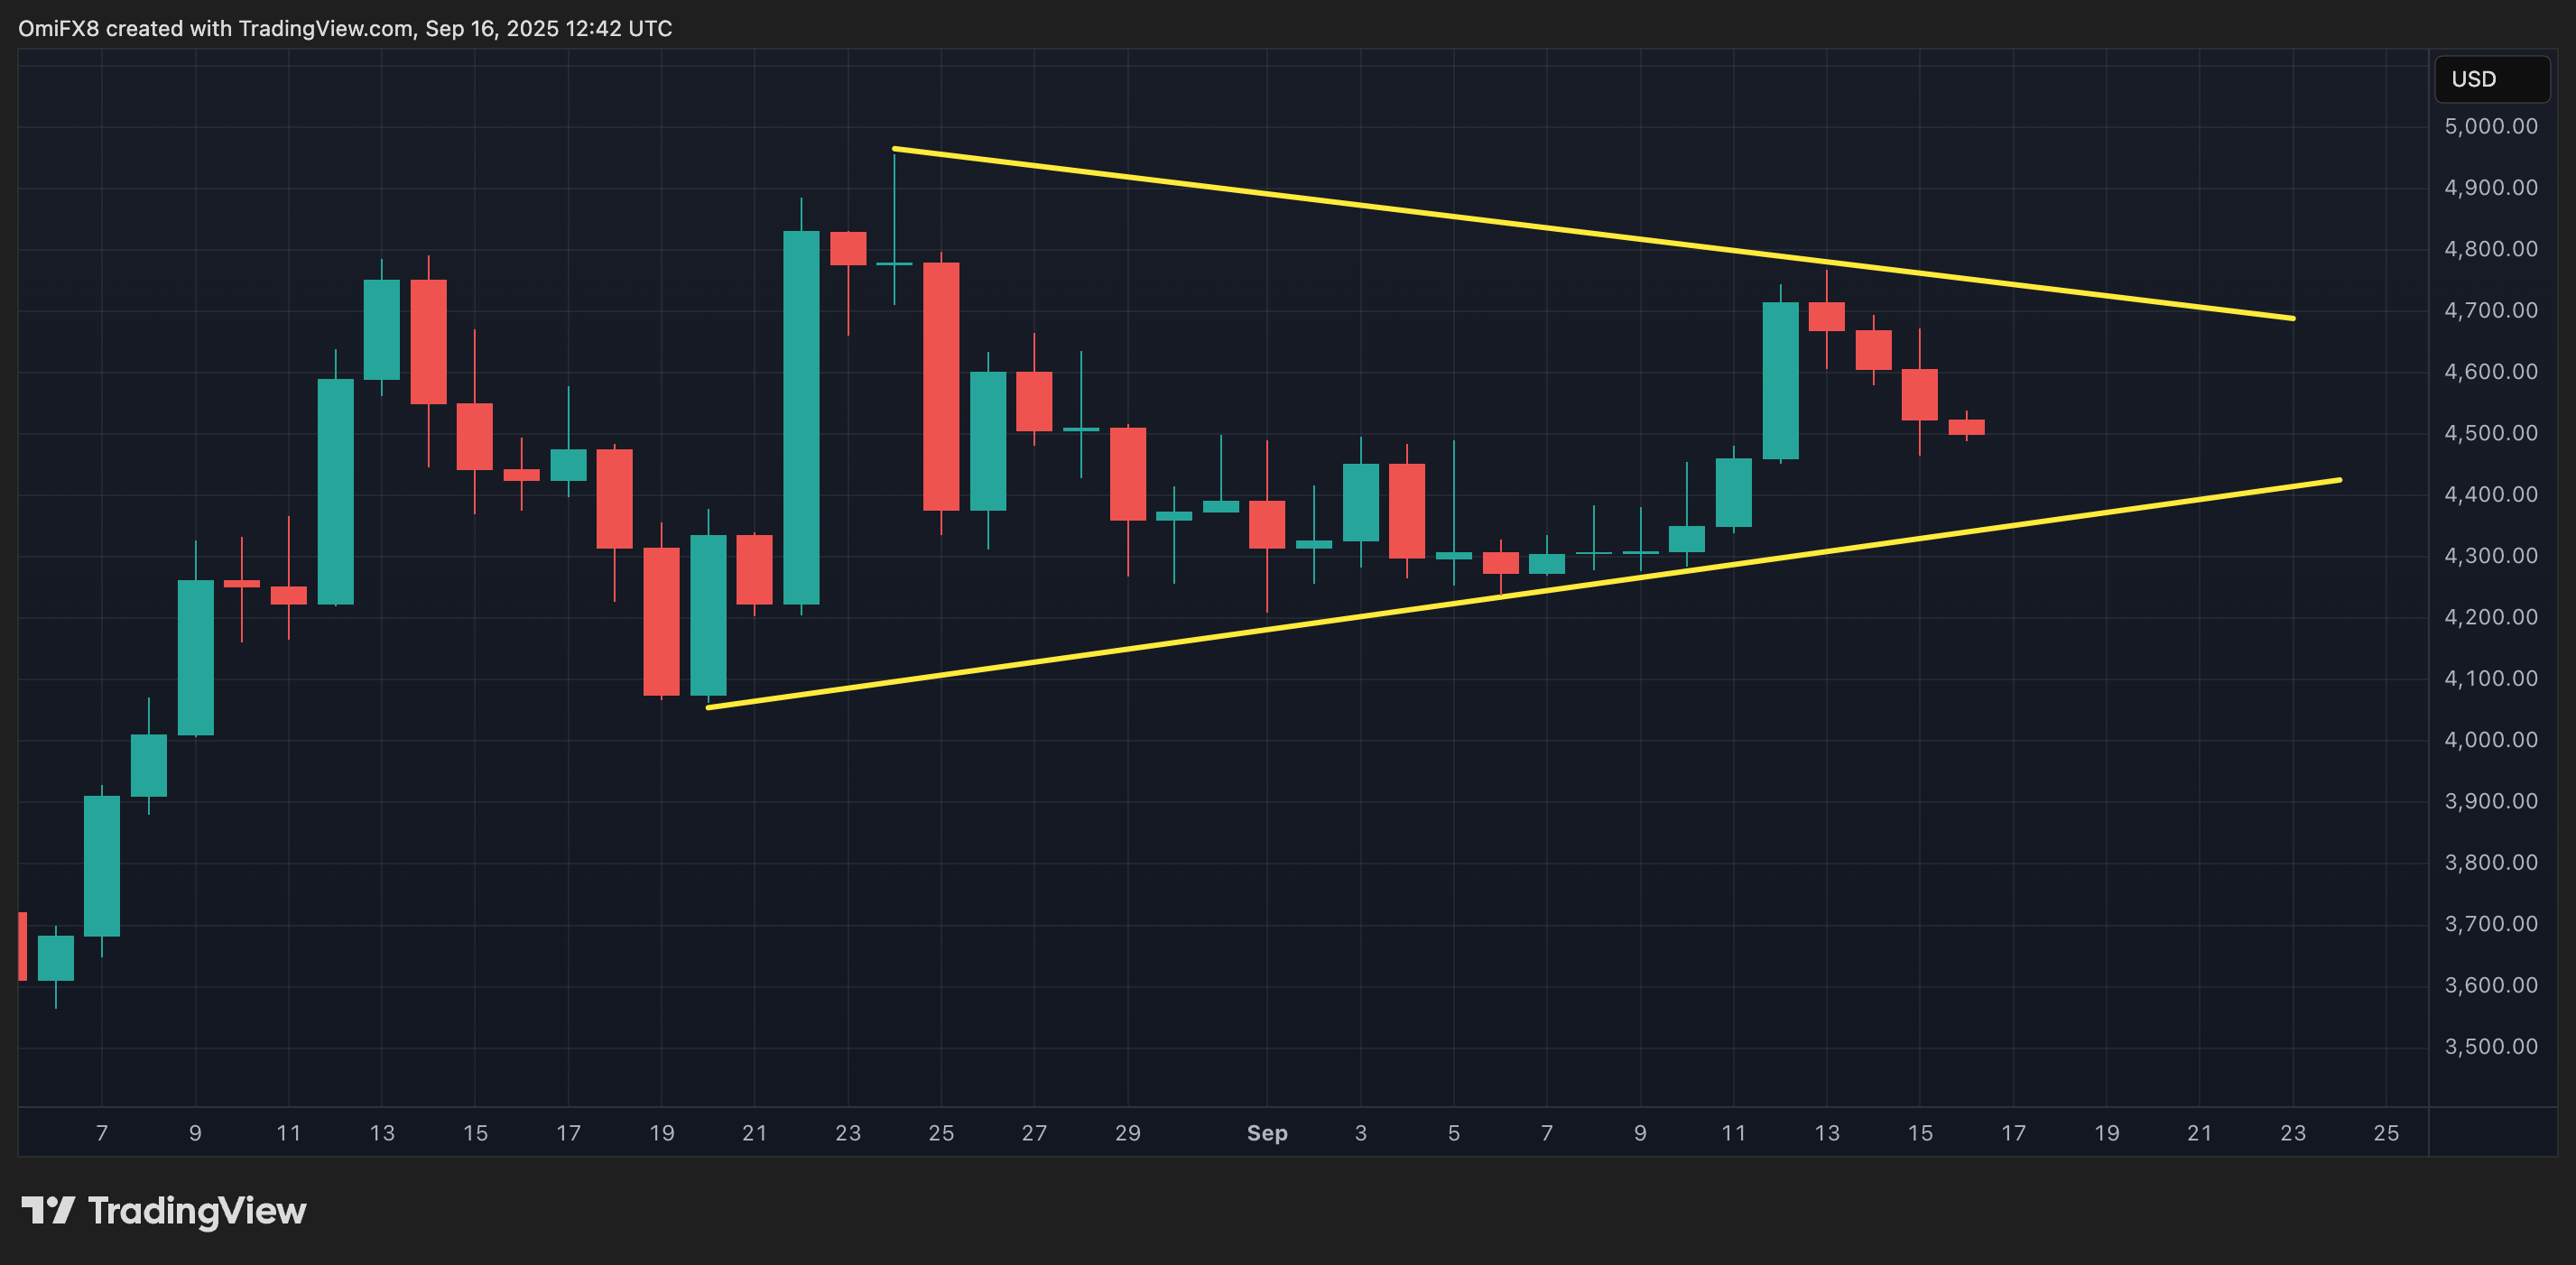
Ether's narrowing price range
Ether (ETH), meanwhile, seems to have lost its earlier momentum, drifting sideways after hitting an all-time high near $5,000 last month. The price action has formed a symmetrical triangle – a technical pattern representing indecision, where neither bulls nor bears are ready to make a decisive move.
These triangles typically resolve with a breakout or breakdown, setting the tone for the next directional move. For now, it’s best to wait for clear signals as Ether’s price consolidates within this tightening range.