ETH Set to Hit $5,500 by Mid-October, Predicts Fundstrat’s Global Head of Technical Strategy

Ethereum rockets toward unprecedented heights as Fundstrat's top technical strategist lays out the path to $5,500.
The Momentum Builds
Fresh analysis from Wall Street's technical vanguard points to a blistering rally for ETH—targeting that magic number just weeks from now. No vague promises here, just hard numbers and chart-driven conviction.
Timing the Breakout
Mid-October isn't picked out of thin air. Historical volatility patterns, institutional accumulation signals, and options flow all scream one thing: prepare for liftoff. Forget hopium—this is data talking.
Why It Matters
Another day, another price prediction—but when it comes from a firm that eats volatility for breakfast, maybe it’s worth a second look. Or just another excuse for traders to justify their leverage addiction.
Brace for impact—or another classic crypto fakeout.
Fundstrat's View
Mark Newton, Global Head of Technical Strategy at Fundstrat Global Advisors, described the decline as the correction the market missed last week.
He does not expect ether to fall below its prior low of $4,233. Instead, he sees possible dips to $4,418 or $4,375 by week’s end — levels he calls buying opportunities. Newton projects ether could climb to $5,500 by mid-October, pointing to continued market strength.
CoinDesk Research's Technical Analysis
According to CoinDesk Research's technical analysis data model, ether lost about 3% during Sept. 15’s trading window, dropping from a peak of $4,619 to around $4,500.
The steepest slide occurred between 07:00 and 08:00 UTC, when prices fell sharply from $4,632 to $4,514. Trading activity surged during that period, with volume more than doubling the daily average of 194,000 units and total turnover for the session reaching 501,741 units.
After touching a low of $4,471, buyers stepped in to slow the decline. That level has served as a short-term “floor.” On the upside, ether struggled to MOVE past $4,671, which has acted as a “ceiling.”
Later in the session, between 23:00 UTC on Sept. 15 and 00:00 UTC on Sept. 16, prices steadied. Ether edged up from $4,497 to $4,505 and narrowed into a tight band between $4,479 and $4,505. Buyer interest around $4,490–$4,495 helped stabilize the market, but the token could not reclaim $4,530, showing sellers still had control at higher levels.
In total, the trading window covered a $200 range between $4,471 and $4,671, underscoring heightened uncertainty. The data shows ether beginning to stabilize after the sharp drop, with demand visible at lower levels but strong resistance capping near-term gains.
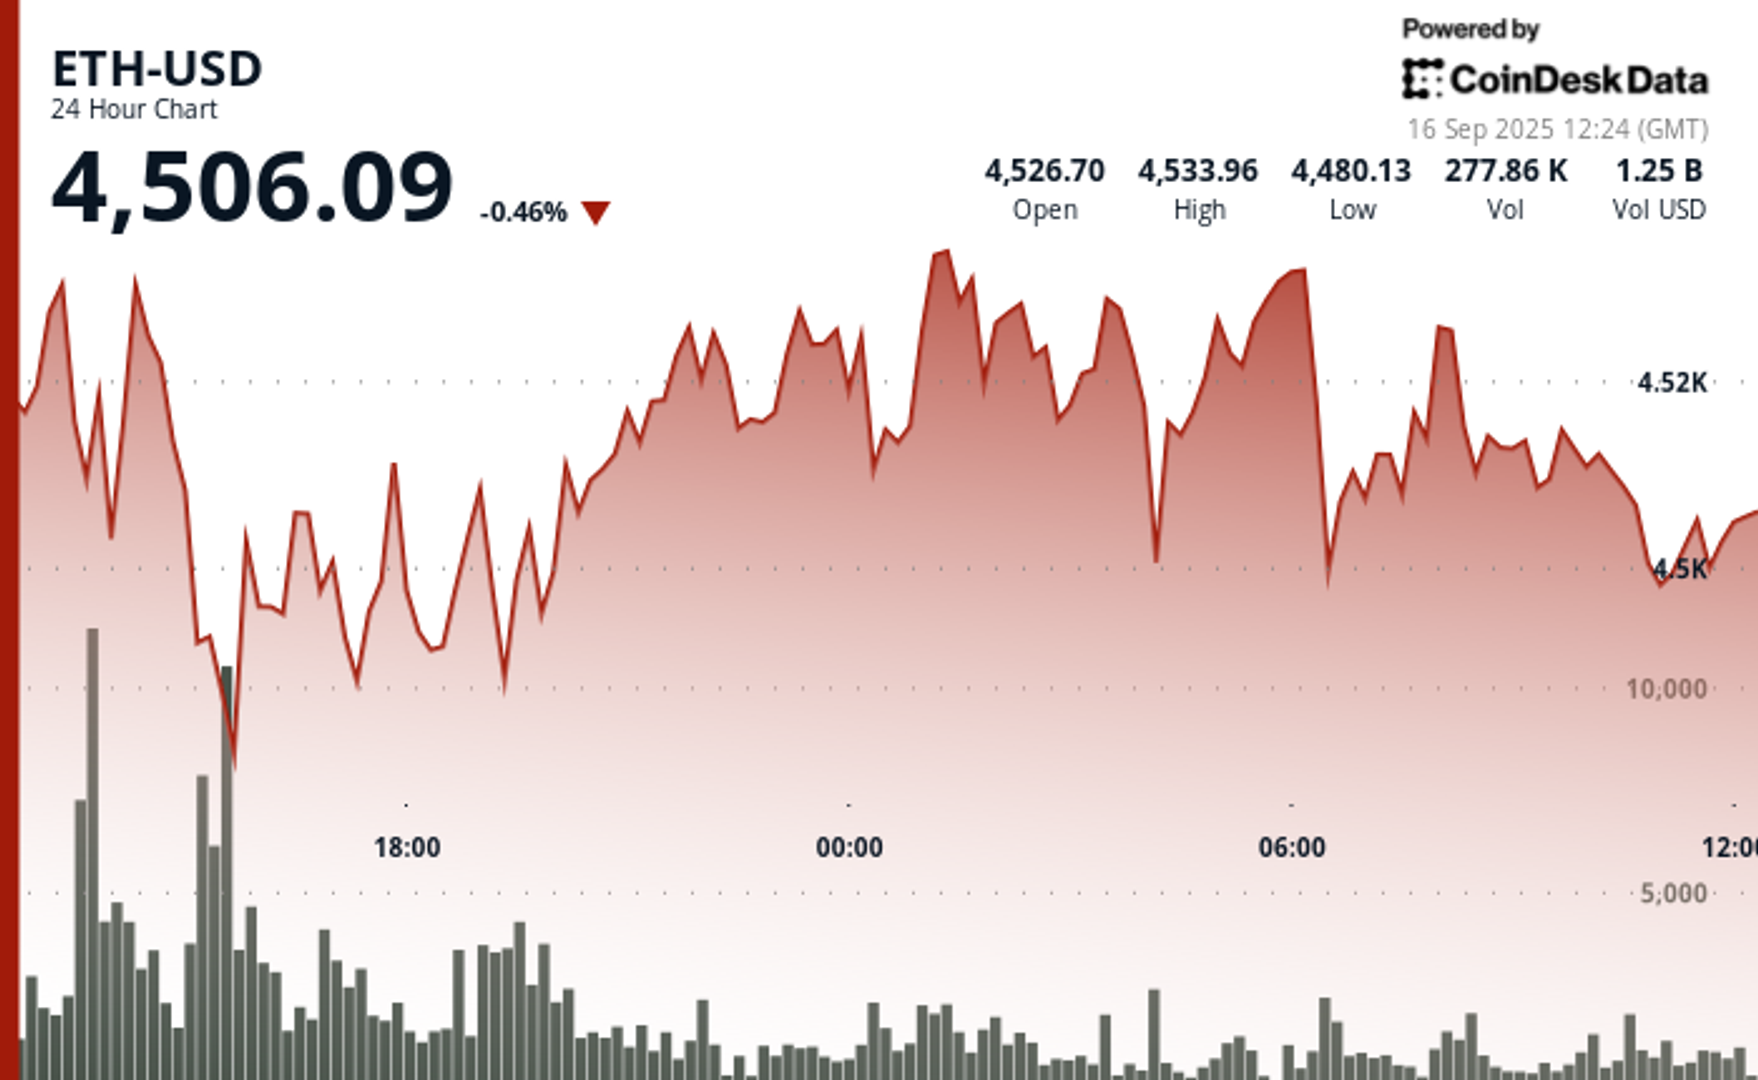
Latest 24-Hour Chart Analysis
The most recent CoinDesk Data chart, generated at 12:24 UTC on Sept. 16, shows ether holding NEAR $4,506 after a turbulent day. The token remains boxed between its $4,471 floor and $4,671 ceiling, with little progress in breaking higher. Trading over the past 12 hours has tilted toward consolidation, signaling the market may be waiting for the next catalyst after Monday’s heavy selloff.
Parts of this article were generated with the assistance from AI tools and reviewed by our editorial team to ensure accuracy and adherence to our standards. For more information, see CoinDesk's full AI Policy.
