Bitcoin Soars Amid Economic Turmoil — Bullish Breakout or Bearish Mirage?

Bitcoin defies crumbling traditional markets as economic cracks widen—digital gold narrative intensifies.
Decoupling or Dead Cat Bounce?
The rally challenges conventional wisdom that crypto follows risk assets. While stocks tumble and bonds waver, Bitcoin's surge suggests something more fundamental at play—either genuine flight to safety or speculative froth reaching new extremes.
Institutional flows tell part of the story. Whale accumulation patterns mirror early 2021 behavior, though regulatory uncertainty keeps traditional finance dinosaurs watching from the sidelines. Meanwhile, retail FOMO builds—because nothing says 'sound investment' like chasing 20% daily moves while the global economy teeters.
Technical indicators flash conflicting signals. RSI approaches overbought territory while volume patterns suggest sustained momentum. The $100K psychological barrier looms large—break it and skeptics face existential crisis; reject there and the 'safe haven' thesis gets another nail in its coffin.
Traditional finance pundits dismiss the move as pure speculation. They're probably right—but then again, these are the same geniuses who thought negative-yielding bonds were a brilliant idea.
Bitcoin's ultimate test approaches. Either it proves its mettle as uncorrelated store of value during systemic stress—or reveals itself as just another risk asset wearing digital camouflage.
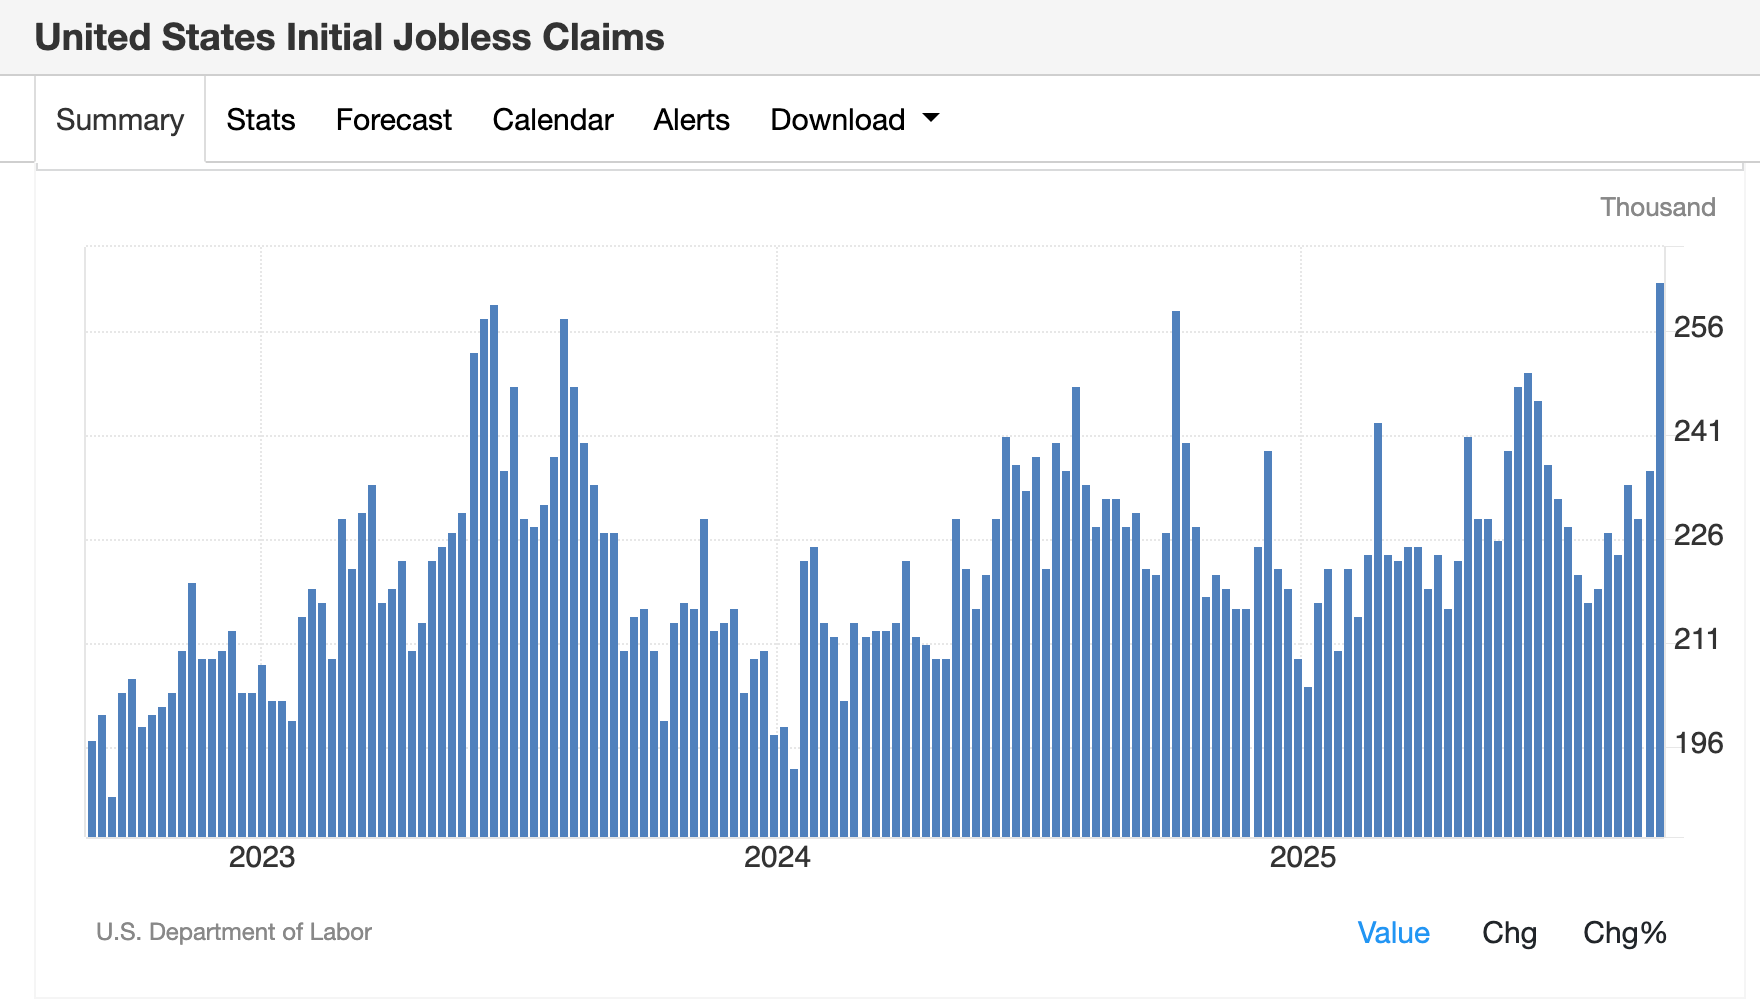
Higher inflation and fewer jobs are not great for the U.S. economy, so it's no surprise that the word "stagflation" is starting to creep back into macroeconomic commentary.
Against this backdrop, bitcoin—considered a risk asset by Wall Street—continued grinding higher, topping $116,000 on Friday and almost closing the CME futures gap at 117,300 from August.
Not a surprise, as traders are also bidding up the biggest risk assets: equities. Just take a look at the S&P 500 index, which closed at a record for the second day on the hope of a rate cut.
So how should traders think about BTC's price chart?
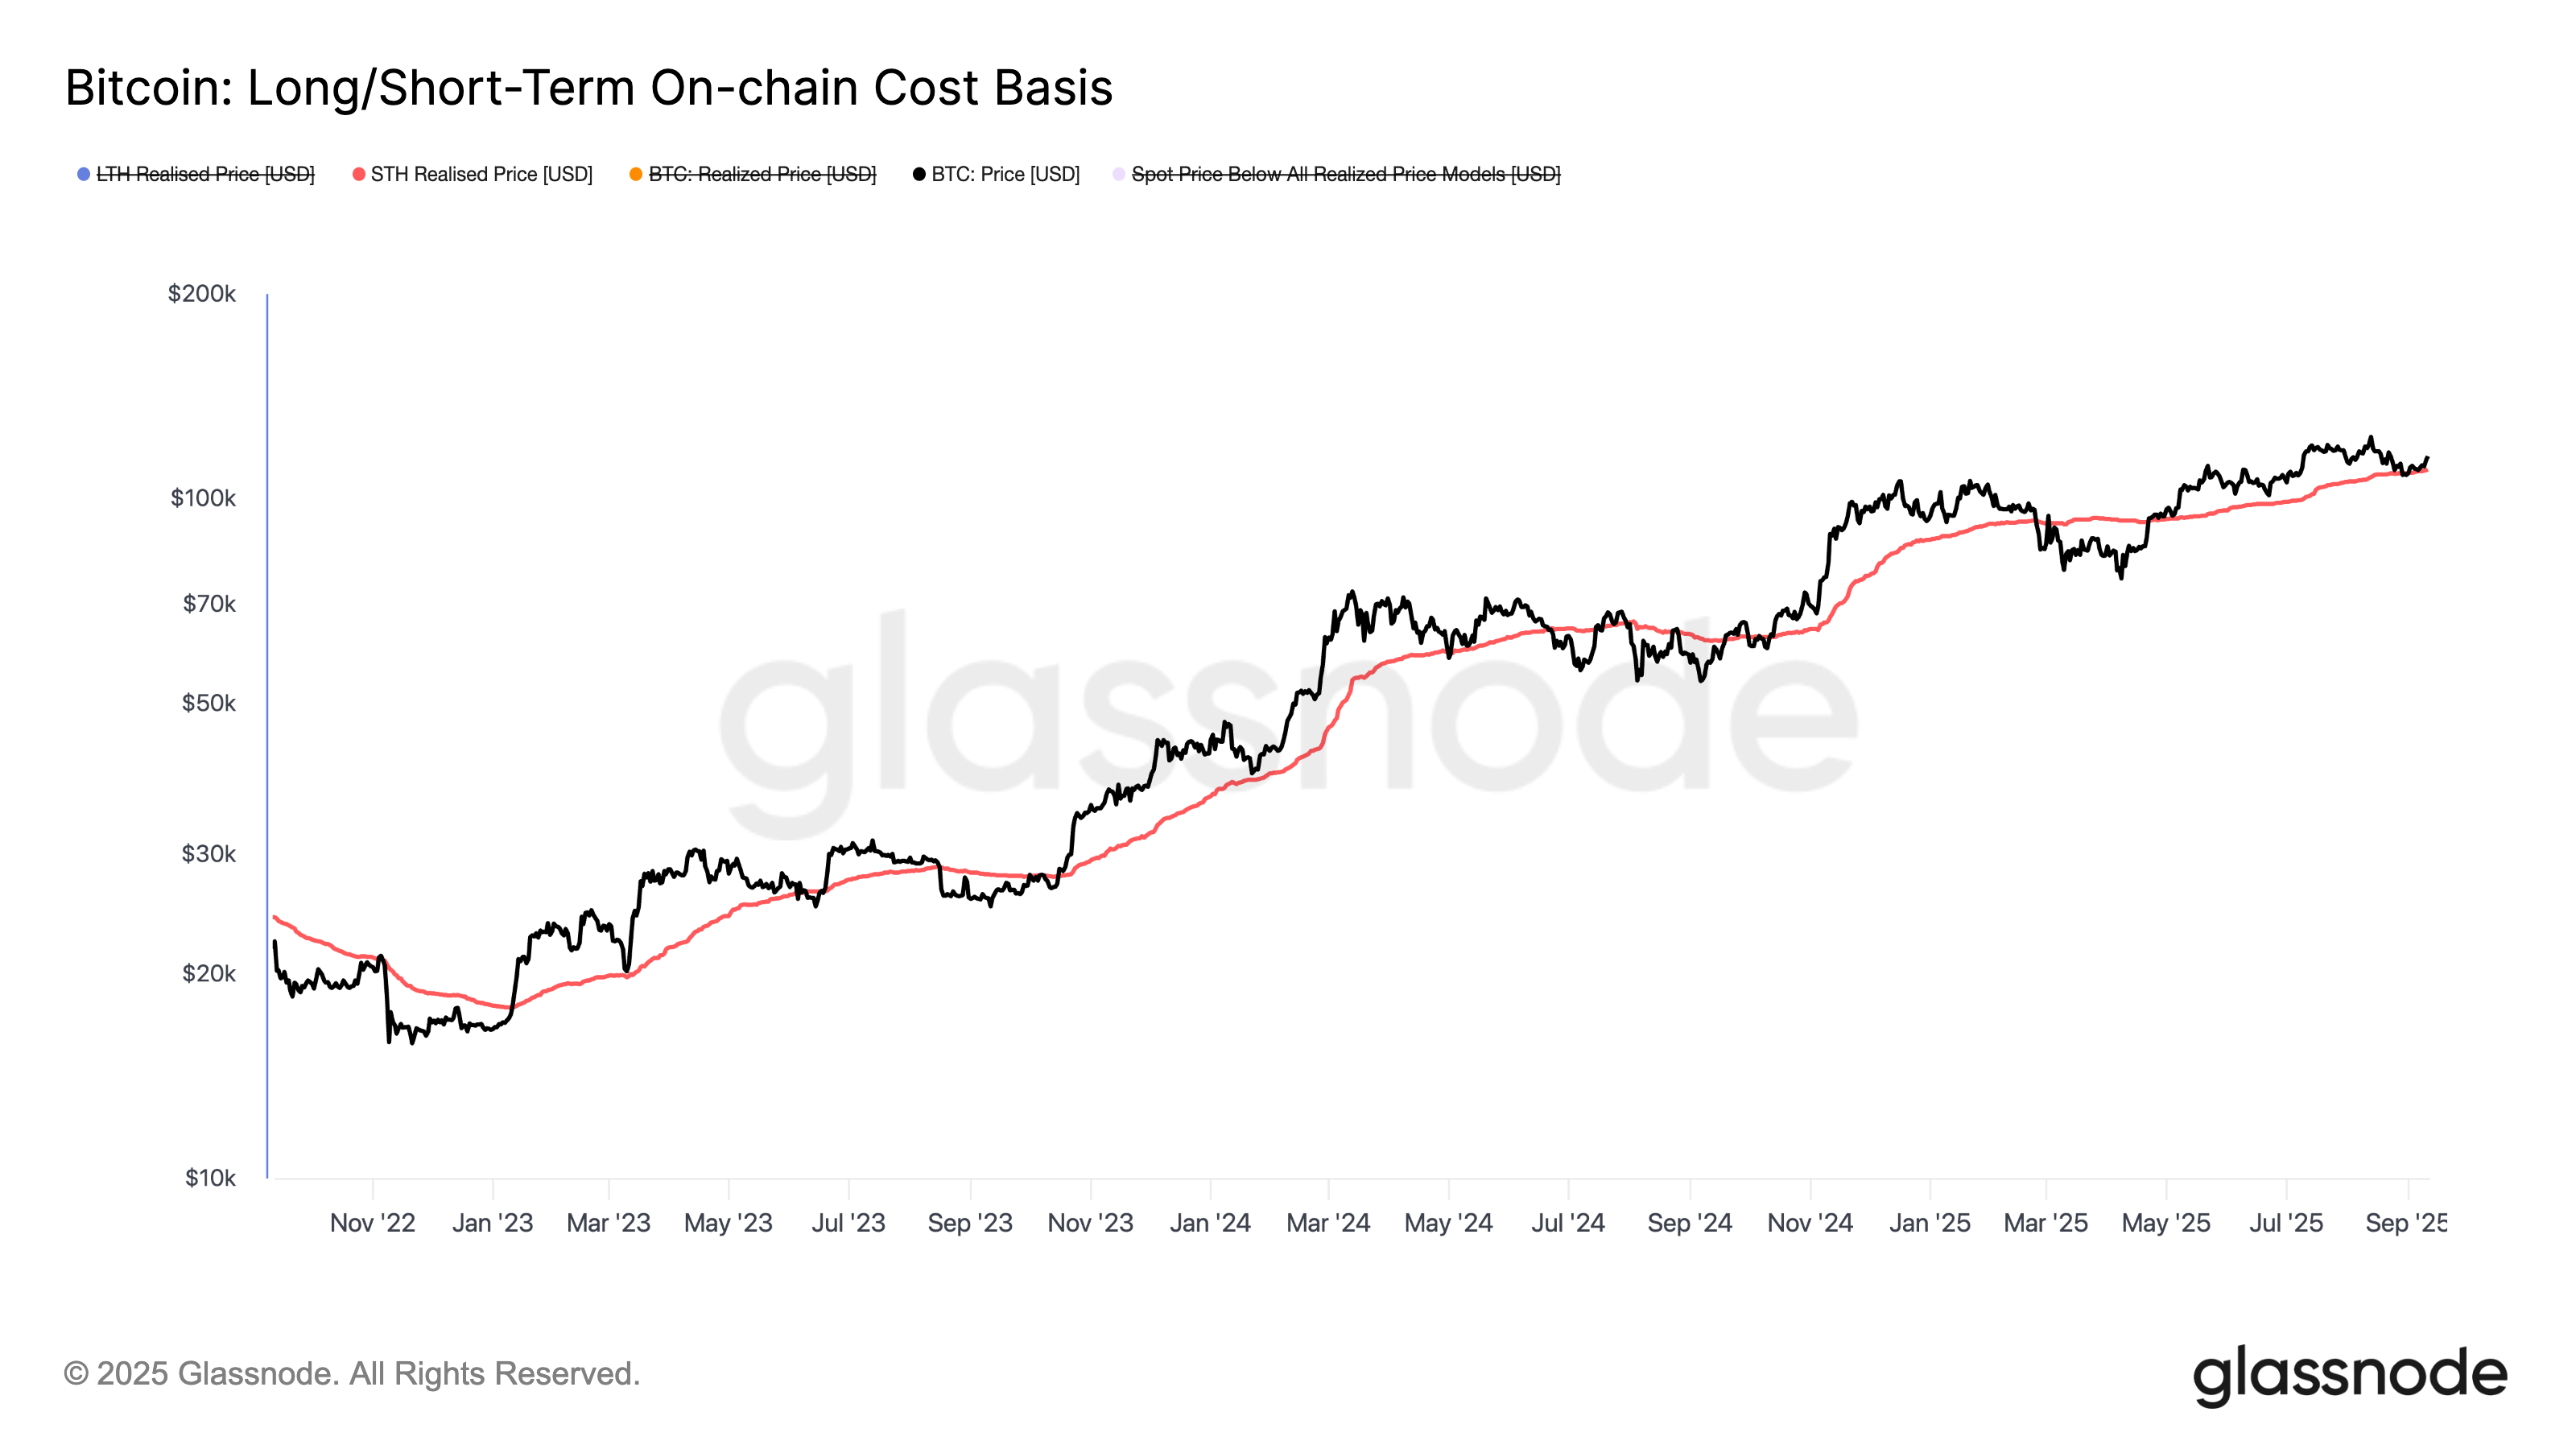
To this chart enthusiast, price action remains constructive, with higher lows forming from the September bottom of $107,500. The 200-day moving average has climbed to $102,083, while the Short-Term Holder Realized Price — often used as support in bull markets — rose to a record $109,668.
Bitcoin-linked stocks: A mixed bag
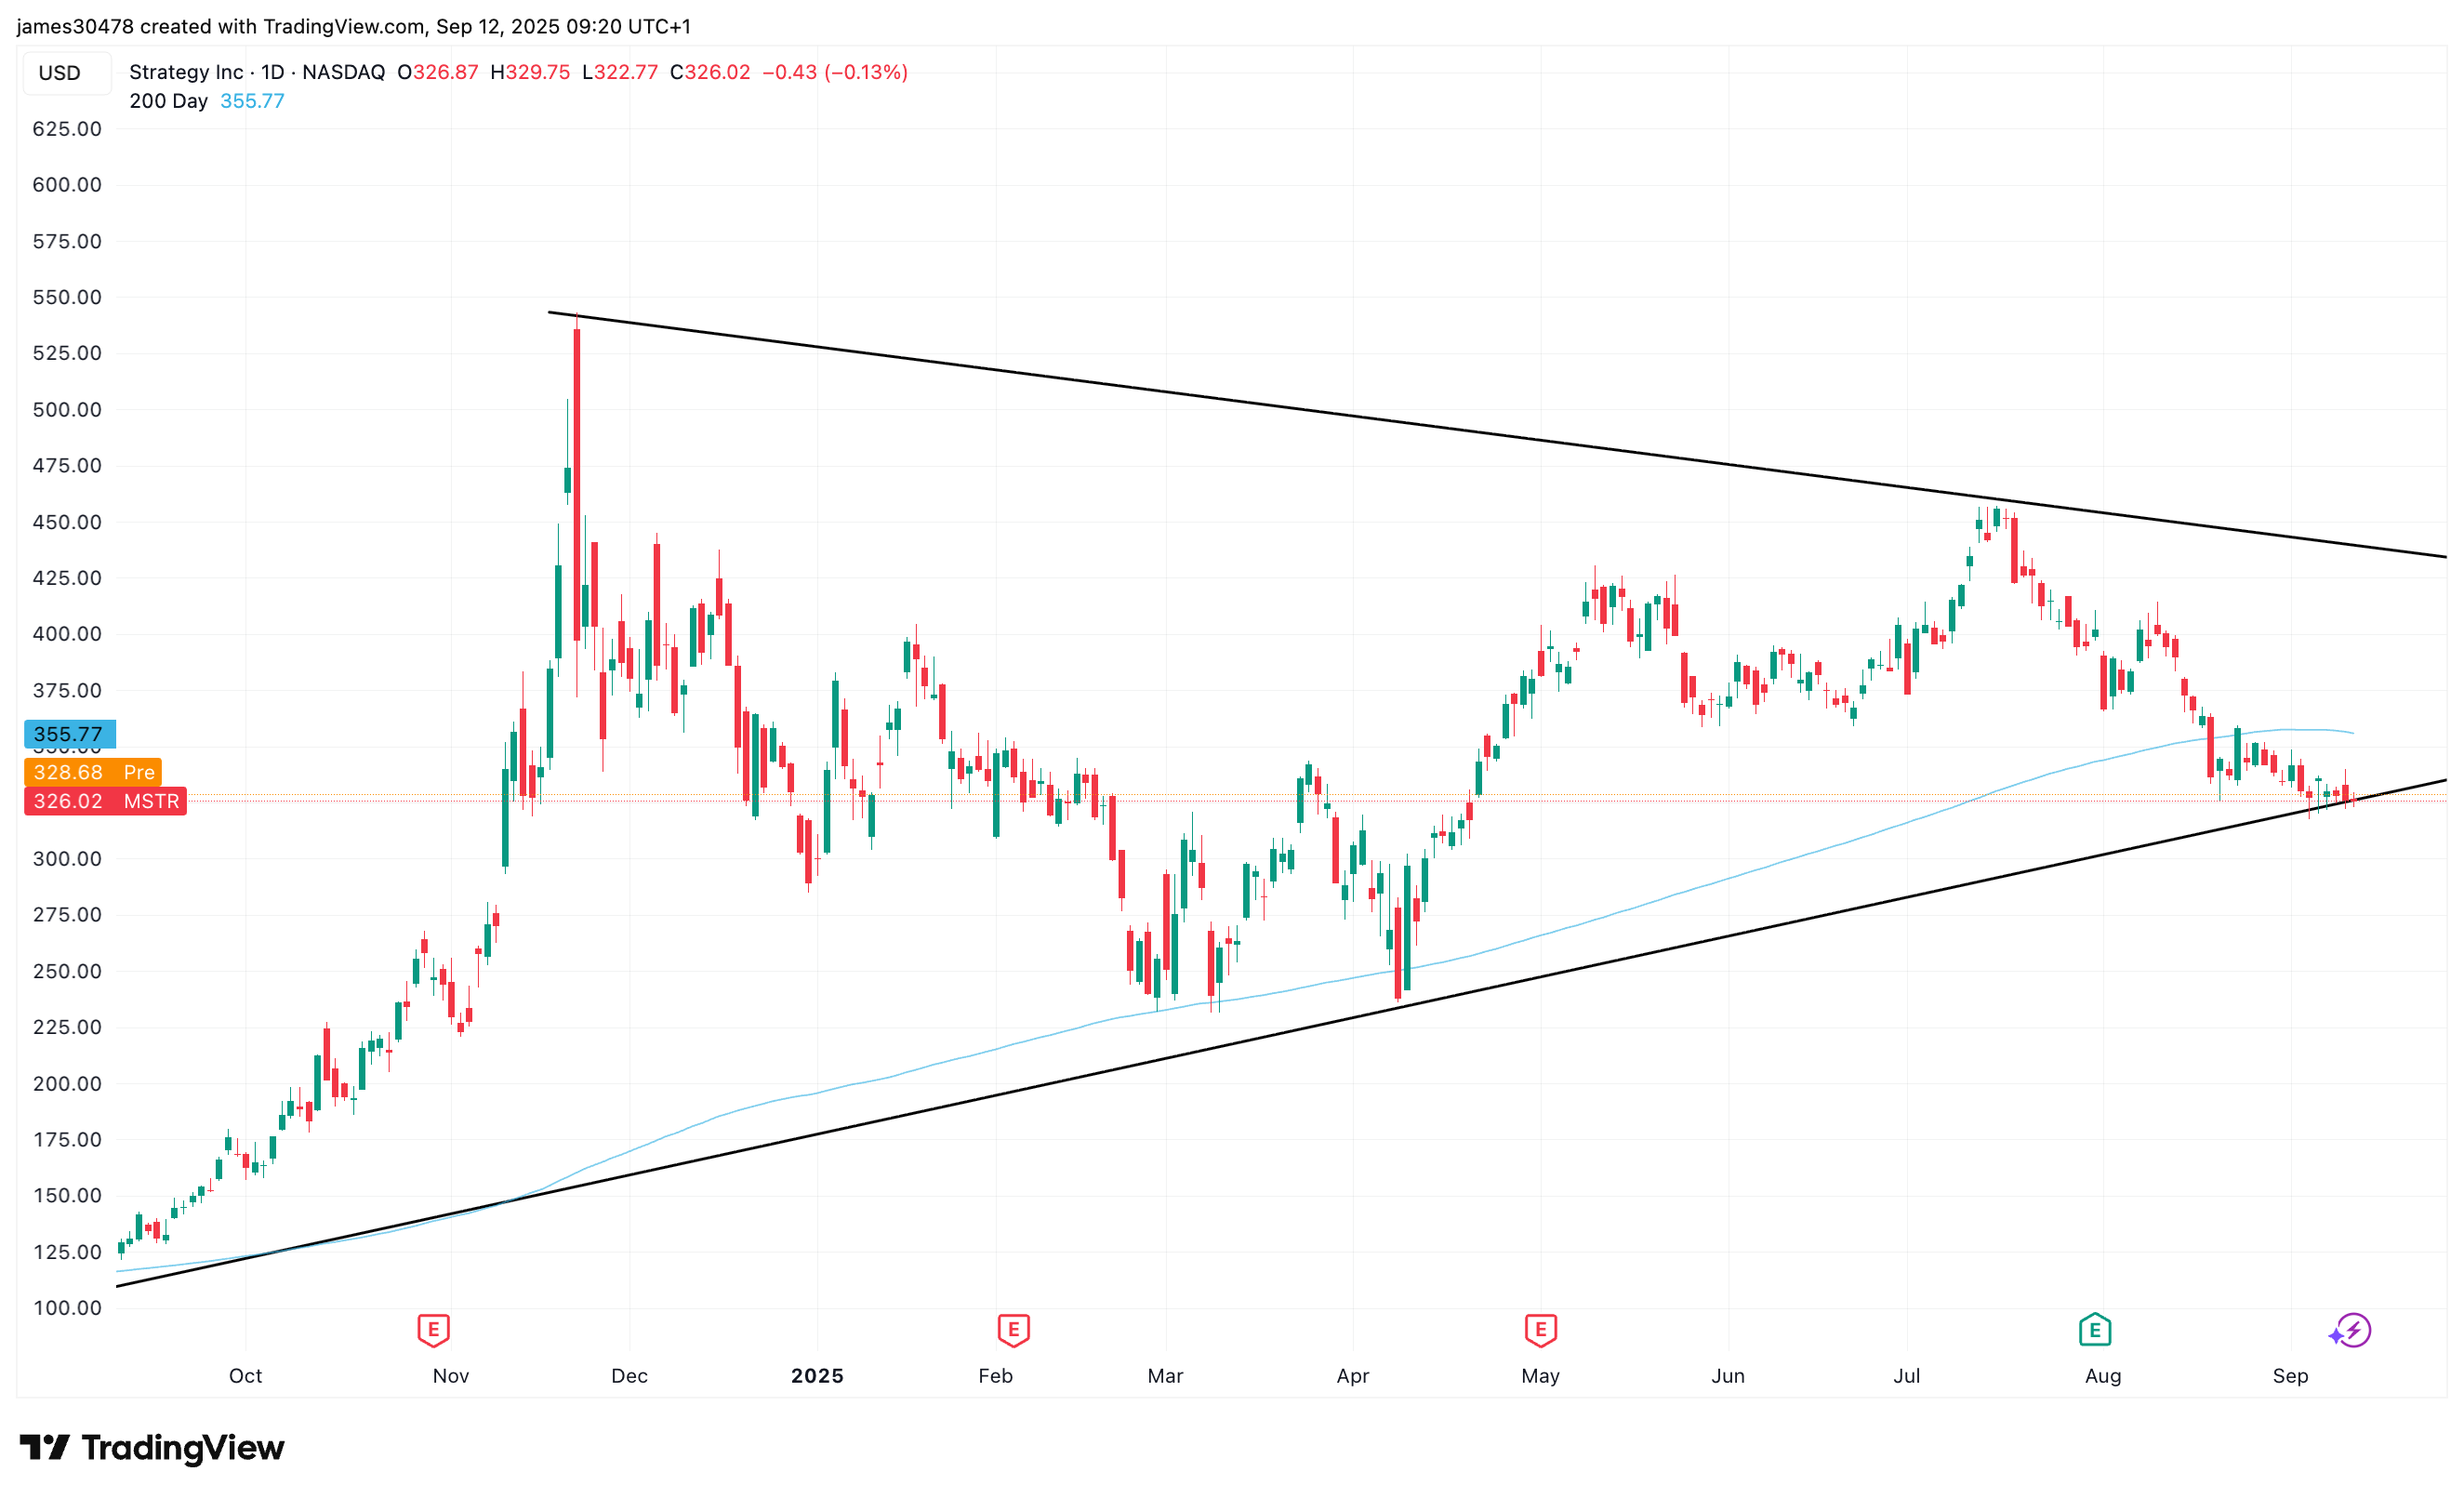
However, bitcoin's weekly positive price action didn't help Strategy (MSTR), the largest of the bitcoin treasury companies, whose shares were about flat for the week. Its rivals performed better: MARA Holdings (MARA) 7% and XXI (CEP) 4%.
Strategy (MSTR) has underperformed bitcoin year-to-date and continues to hover below its 200-day moving average, currently $355. At Thursday's close of $326, it's testing a key long-term support level seen back in September 2024 and April 2025.
The company’s mNAV premium has compressed to below 1.5x when accounting for outstanding convertible debt and preferred stock, or roughly 1.3x based solely on equity value.
Preferred stock issuance remains muted, with only $17 million tapped across STRK and STRF this week, meaning that the bulk of at-the-money issuance is still flowing through common shares. According to the company, options are now listed and trading for all four perpetual preferred stocks, a development that could provide additional yield on the dividend.
Bullish catalysts for crypto stocks?
The CME's FedWatch tool shows traders expect a 25 basis-point U.S. interest-rate cut in September and have priced in a total of three rate cuts by year-end.
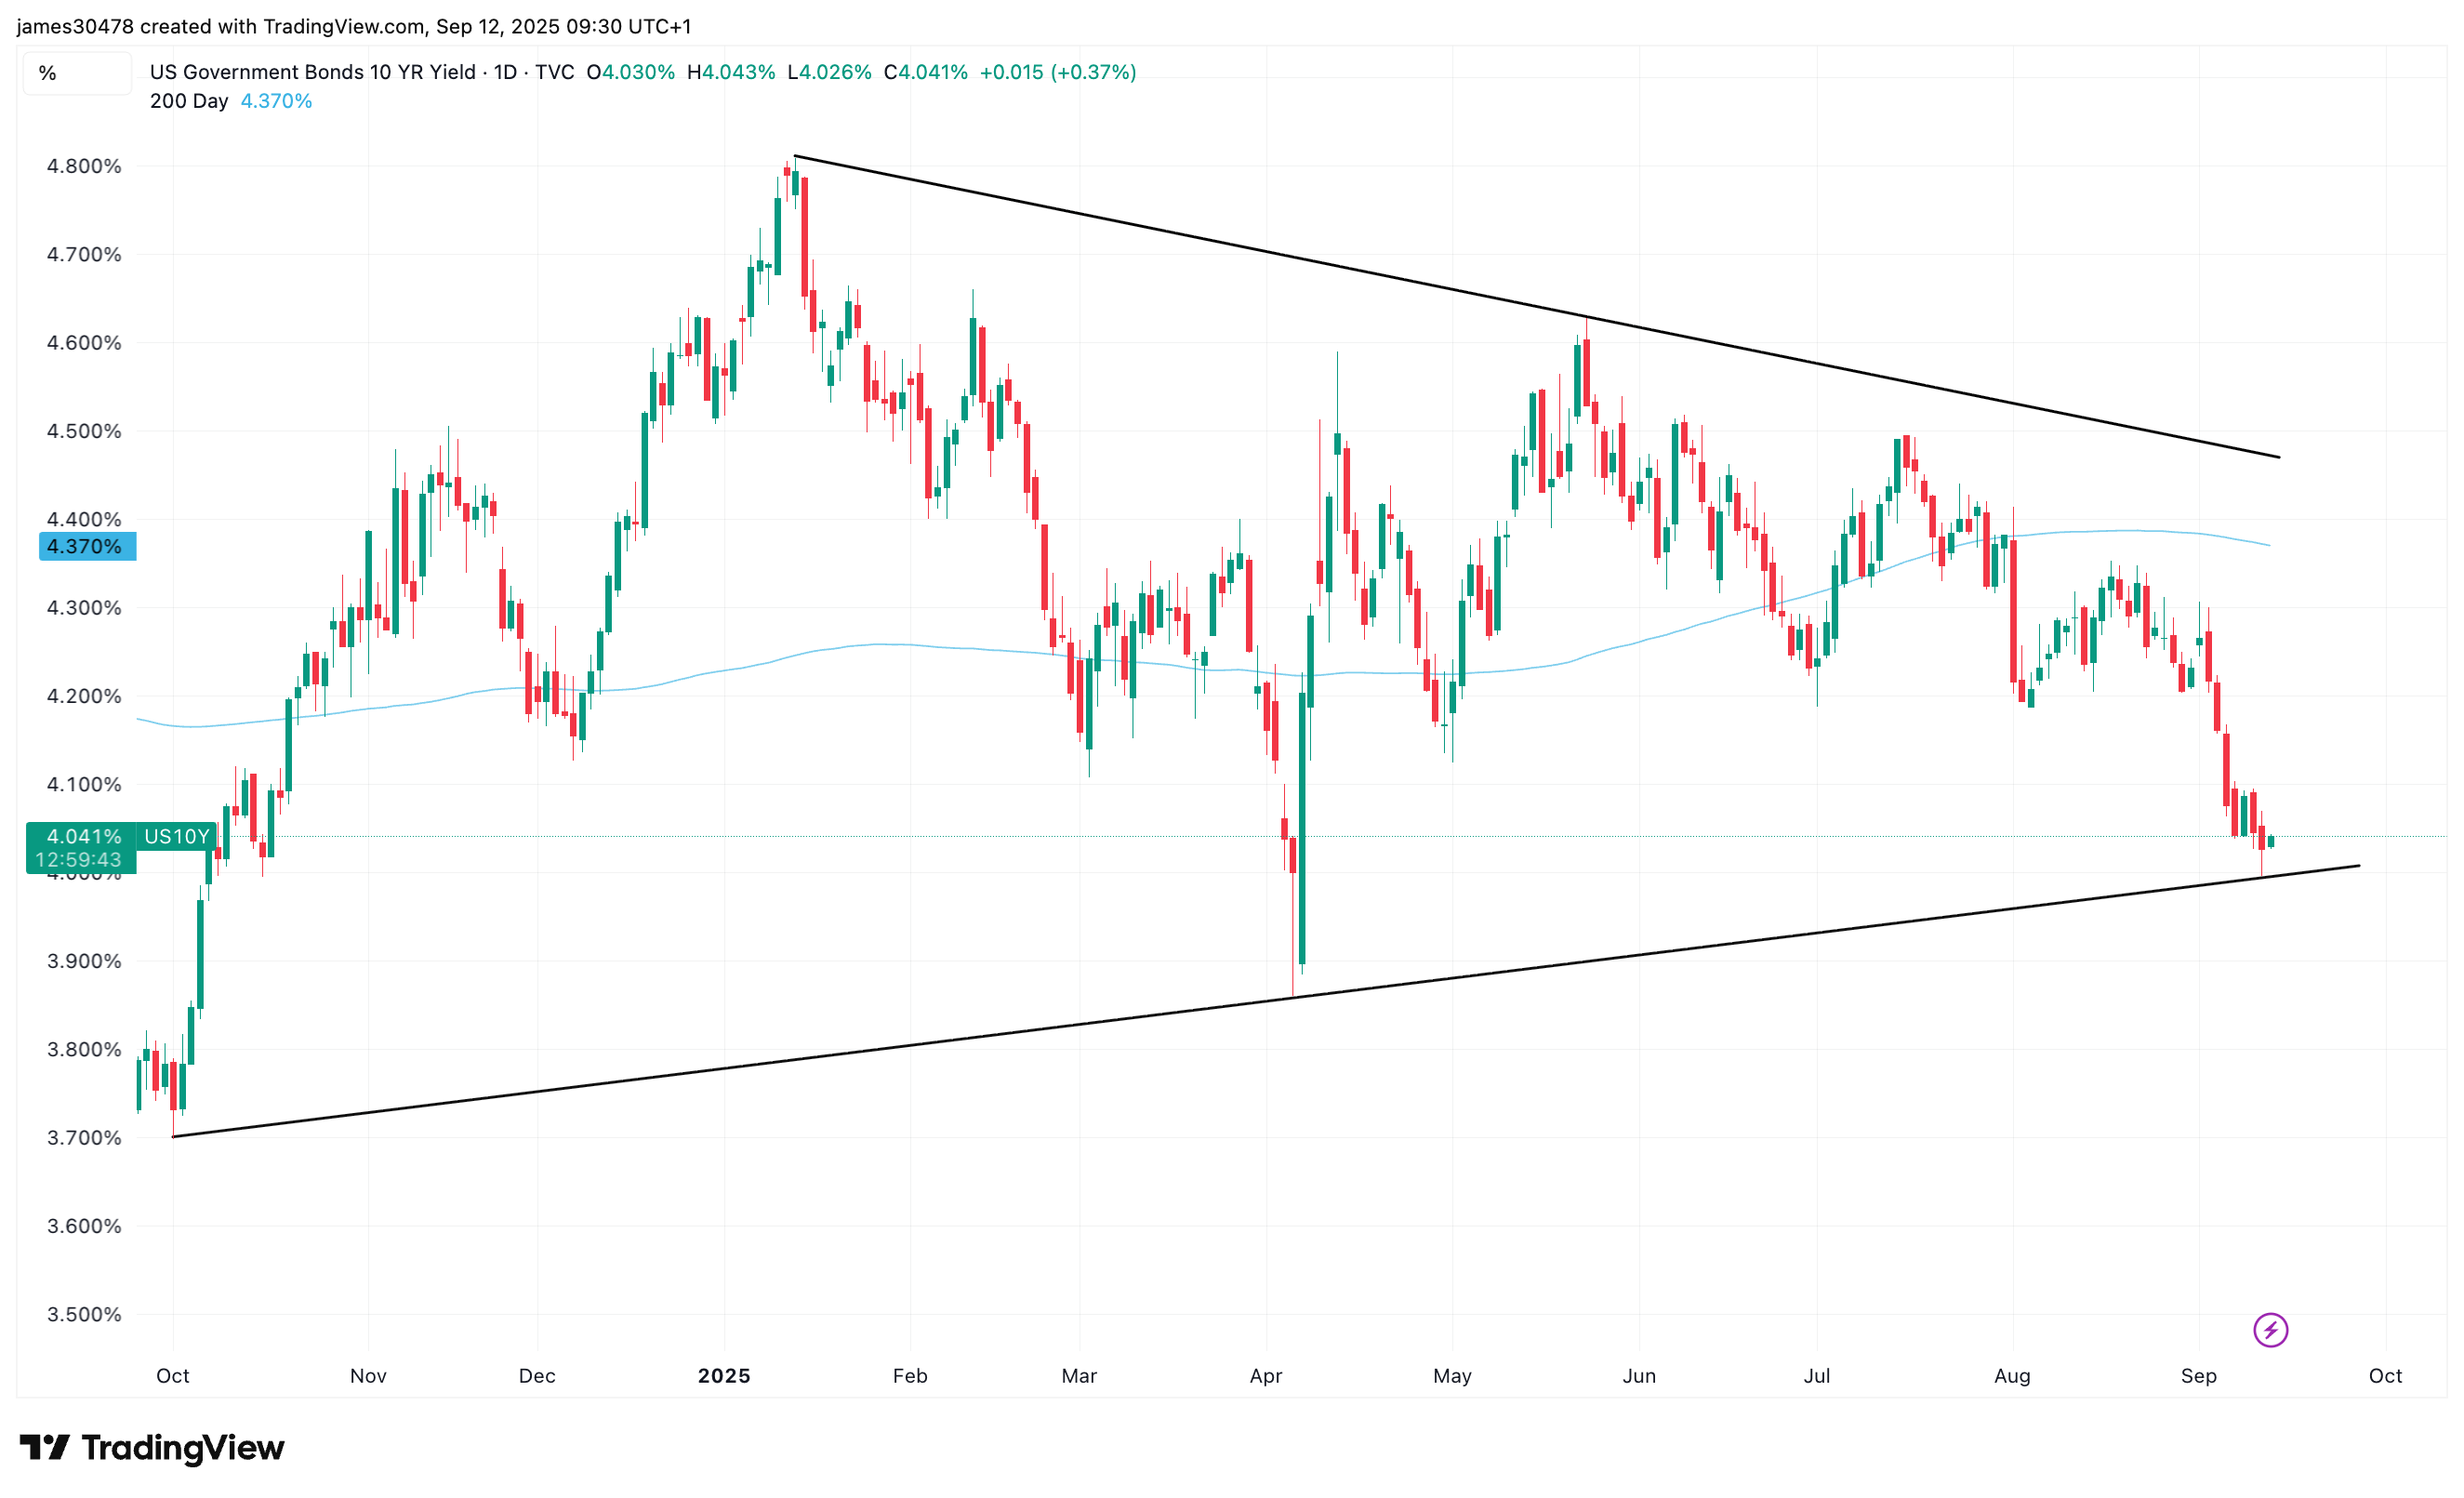
That's a sign risk sentiment could tilt back toward growth and crypto-linked equities, underlined by the 10-year U.S. Treasury briefly breaking below 4% this week.
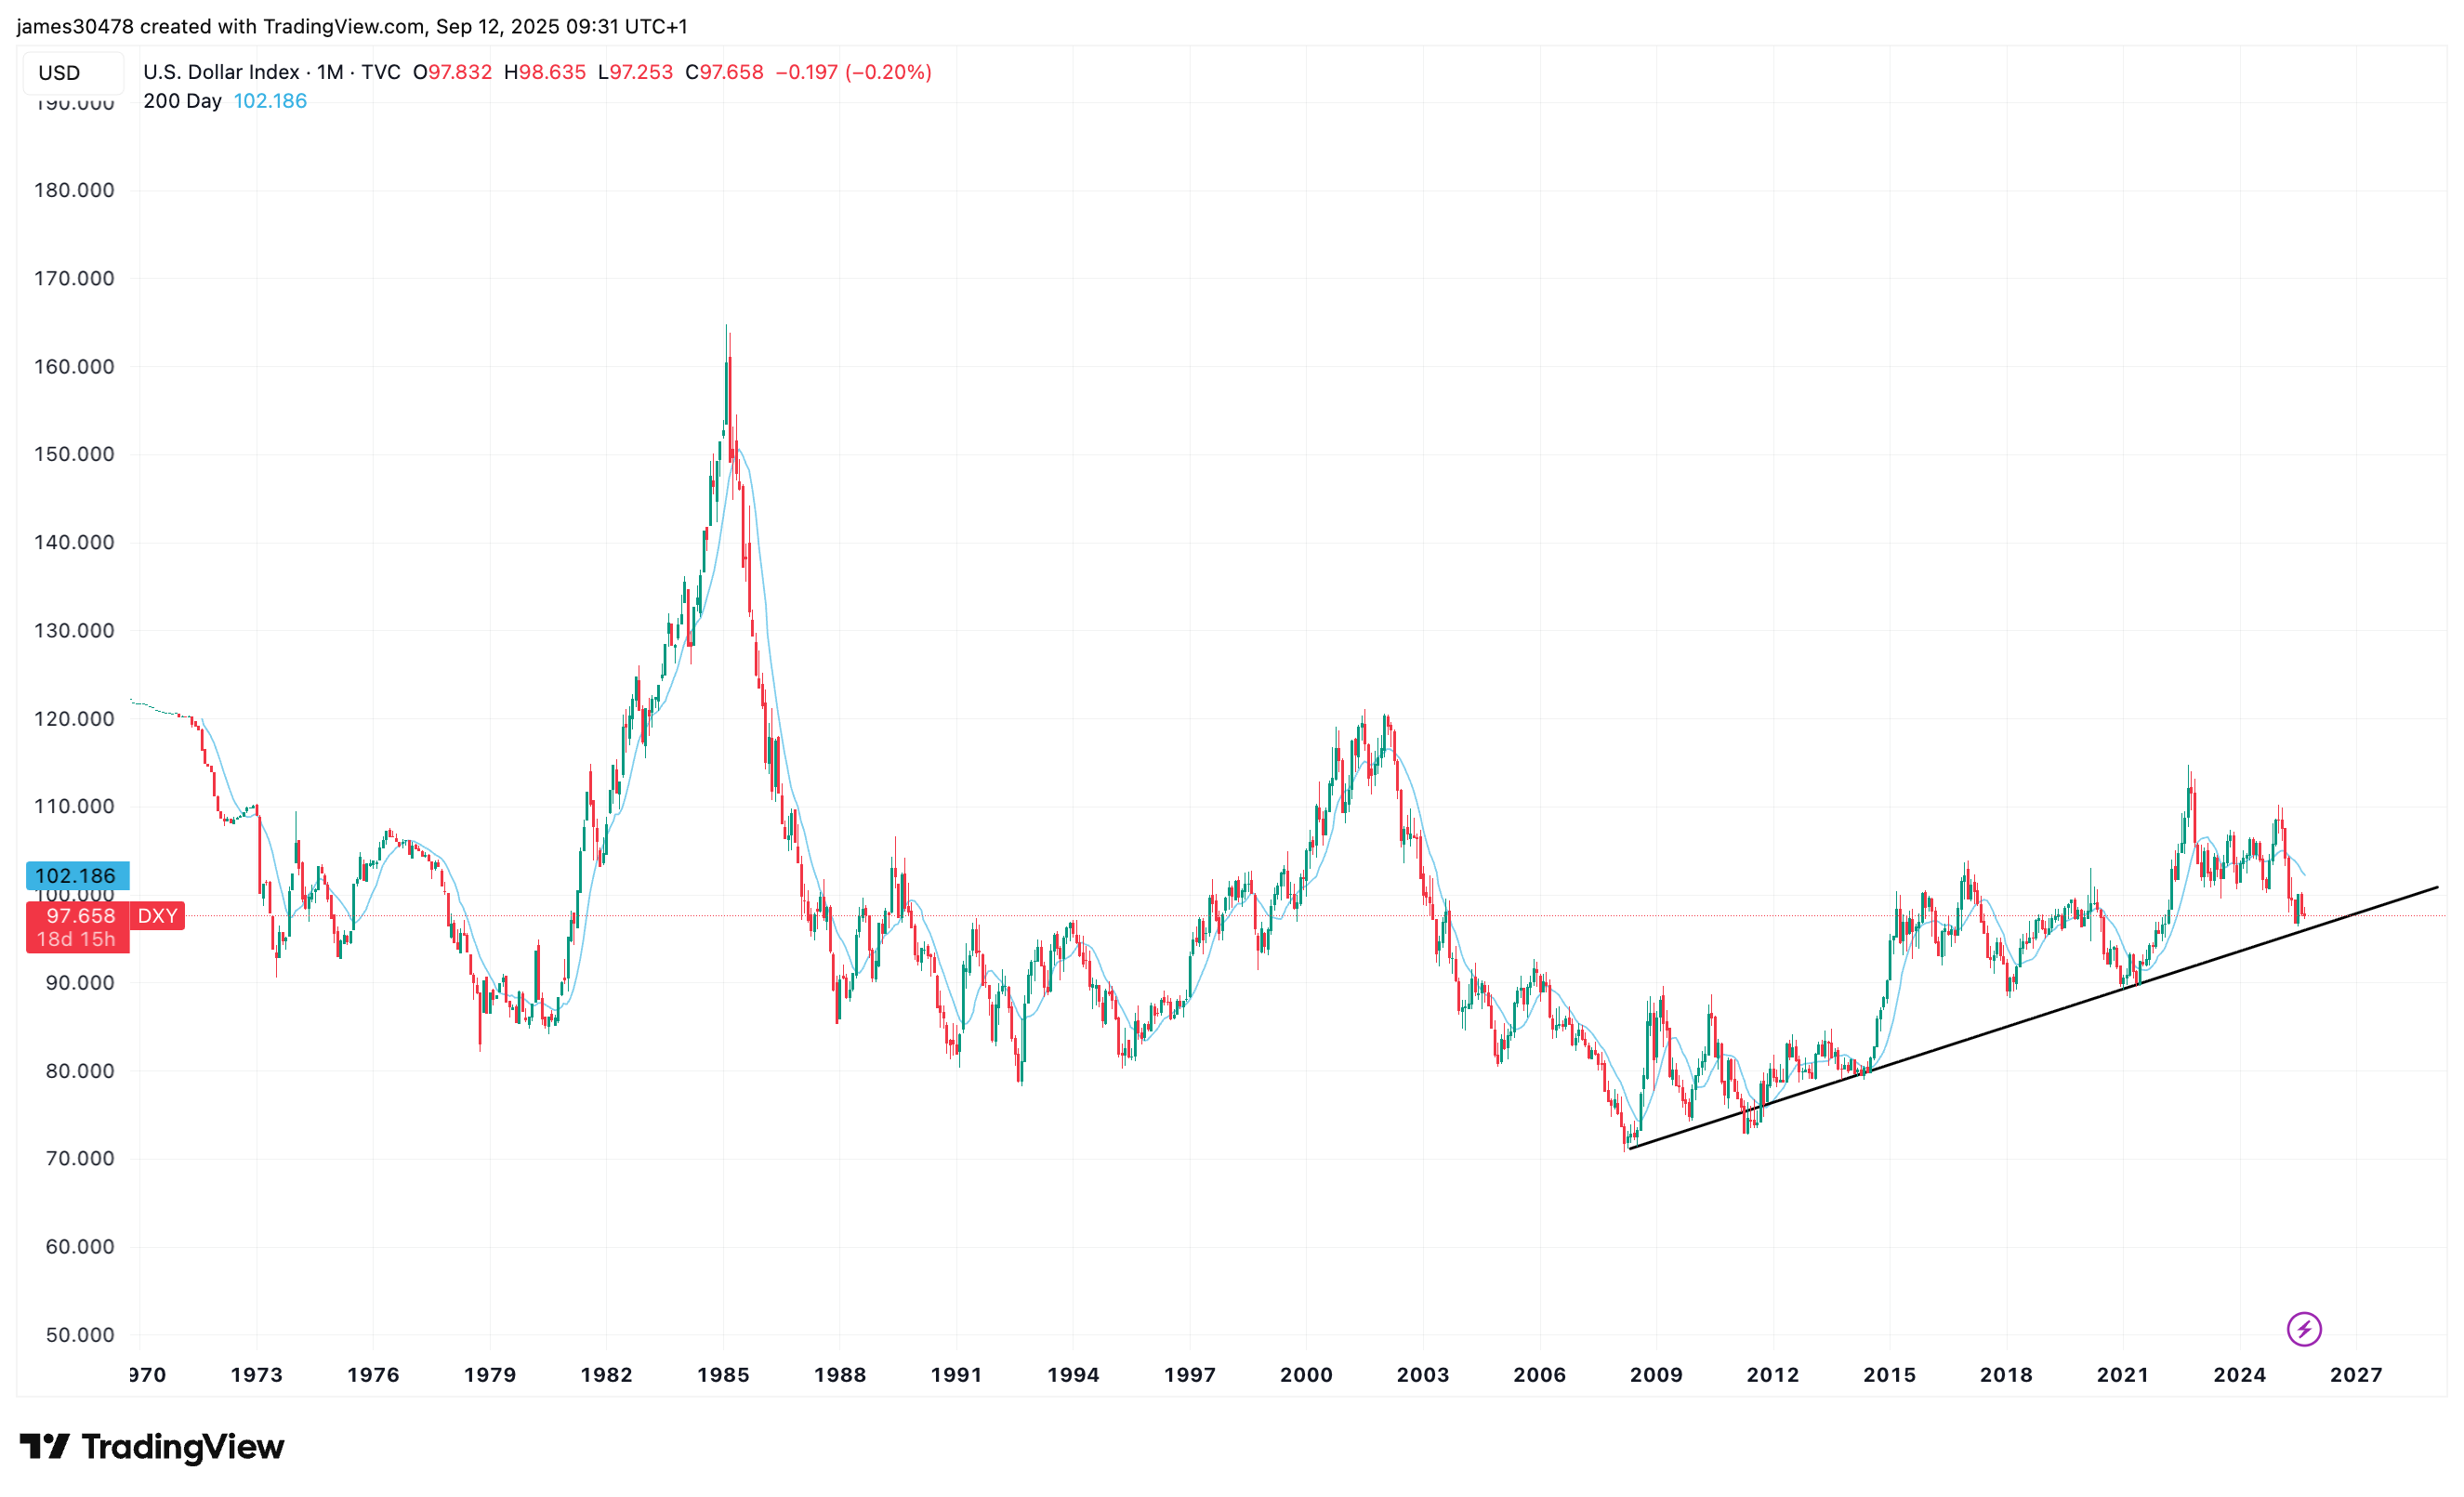
Still, the dollar index (DXY) continues to hold multiyear support, a potential inflection point worth watching.