XRP’s Bearish Signal: Lower Highs Form as Volume Explodes to 169M in Dramatic Reversal

XRP just flashed a classic warning sign—lower highs forming while trading volume spiked to 169 million. Is this the calm before another storm?
The setup: Textbook bearish divergence. Price action paints a weakening uptrend as whales move in. Retail traders? Probably still chasing last week’s hype.
Volume tells the real story. That 169M surge wasn’t organic retail flow—it’s the sound of OTC desks and algo traders repositioning. Meanwhile, the ‘fundamentals crew’ will still argue about SEC lawsuits instead of reading the tape.
Next critical level: If support cracks here, we’re looking at a retest of the August lows. But hey—at least the ‘buy the dip’ crowd gets another entry. Just don’t expect Wall Street to care until the chart looks pretty again.
What to Know
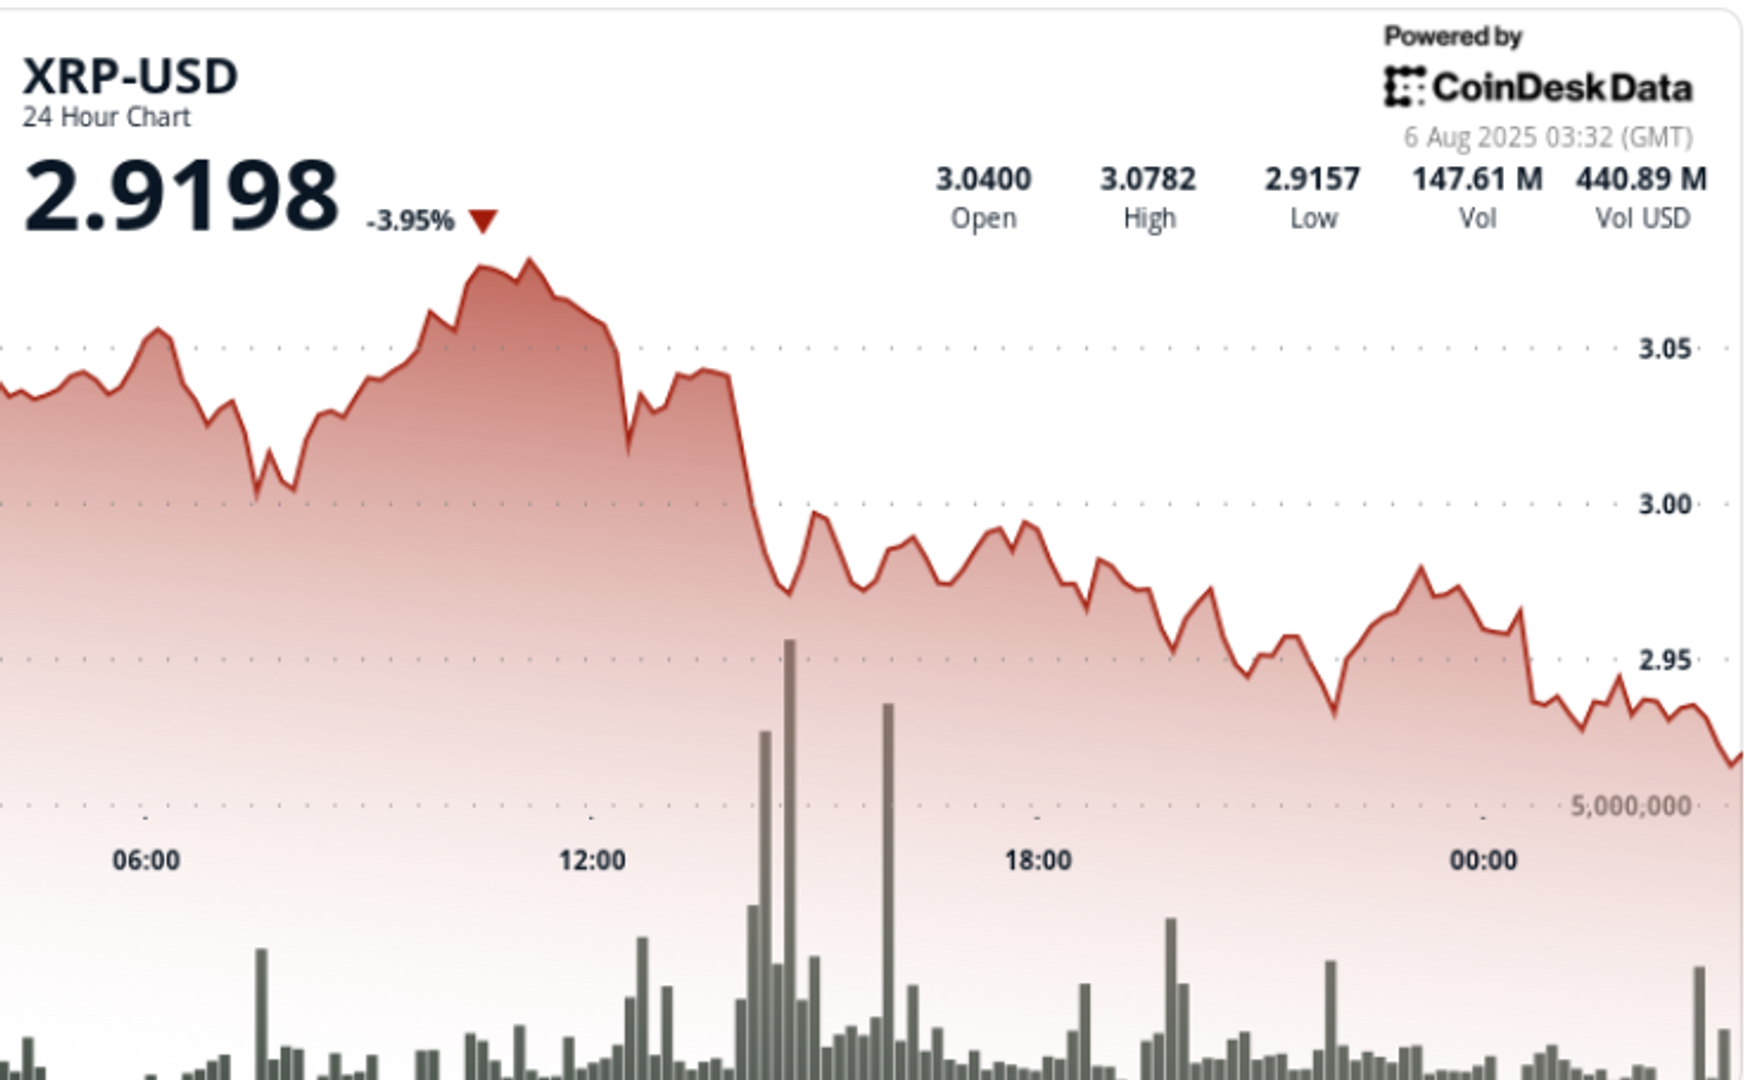
XRP fell 4.2% during the 24-hour session ending August 6 at 02:00, retreating from $3.06 to $2.93 in a volume-driven breakdown. The session’s high of $3.08 was hit at 10:00 before a sharp reversal set in. Price action accelerated at 14:00 when XRP fell from $3.04 to $2.97 on a 169.41 million volume surge — over 3x its 24-hour average of 52.73 million — establishing $3.04 as interim resistance and validating $2.93 as a local support floor.
Final-hour price action confirmed bearish control. XRP slid 1% from $2.94 to $2.92 between 01:15 and 02:14, completing a high-volatility session that saw a $0.13 swing, or 4.2% intraday range. A late 02:11 volume burst of 1.6 million sealed the decline as the token printed fresh intraday lows.
Price Action Summary
- XRP traded within a $0.13 range between $3.08 and $2.93.
- Price collapsed 4.2% on 169.41 million total volume.
- Peak decline occurred between 14:00 and 15:00 with the highest hourly sell volume.
- Final hour saw 1% additional downside, led by a 1.6 million trade at 02:11.
- Resistance caps at $3.04; support forms at $2.93.
- Consolidation range now sits between $2.96 and $2.97.
Technical Analysis
Price structure confirms rejection at $3.04 with immediate downside to $2.93 on above-average volume. The breach of short-term moving averages and failure to sustain above $3.00 point to continuation risk. Volume spikes during key selloff windows support the bearish bias.
Volatility remains elevated with no clear reversal signals printed. If $2.92 fails, next support zones lie NEAR $2.87 and $2.80 based on historical volume nodes.
What Traders Are Watching
- Reclaim of $3.00 psychological level and defense of $2.93 zone.
- Whether bullish divergence emerges on intraday momentum indicators.
- Broader market impact from macro risk-off sentiment driven by geopolitical tensions and renewed trade instability.
