Shiba Inu Plunges 6%—But This Bullish Signal Could Spark a Rebound

Shiba Inu takes a nosedive—down 6% in a brutal sell-off. Yet lurking in the charts? A sneaky inverted hammer, flashing hope for die-hard SHIB bulls.
Technical traders lean in—this classic reversal pattern often signals exhaustion. If buyers step in now, we might just dodge another meme-coin massacre. But let’s be real—since when did crypto charts follow the rules?
One cynical take? Wall Street’s ‘risk management’ teams are probably still figuring out how to spell ‘Shiba.’ Meanwhile, retail traders ride the volatility like a rodeo—wallets clenched, prayers muttered.
Key AI insights for the past 24 hours
- Price rejection at the $0.000013 resistance triggered a high-volume distribution phase.
- The support base was solidified at $0.000012 with 1.19 trillion tokens of buying interest.
- Breakout volume of 90.51 billion catalyzed a move above $0.000012 barrier.
What next?
Despite the recent slide, the technical outlook appears constructive, thanks July's "inverted bullish hammer" candle.
The inverted hammer comprises a long upper wick, a small body and a largely absent lower wick. The shape indicates that while the bulls initially took prices higher, sellers eventually overpowered and pushed prices nearly back to the starting point of the period.
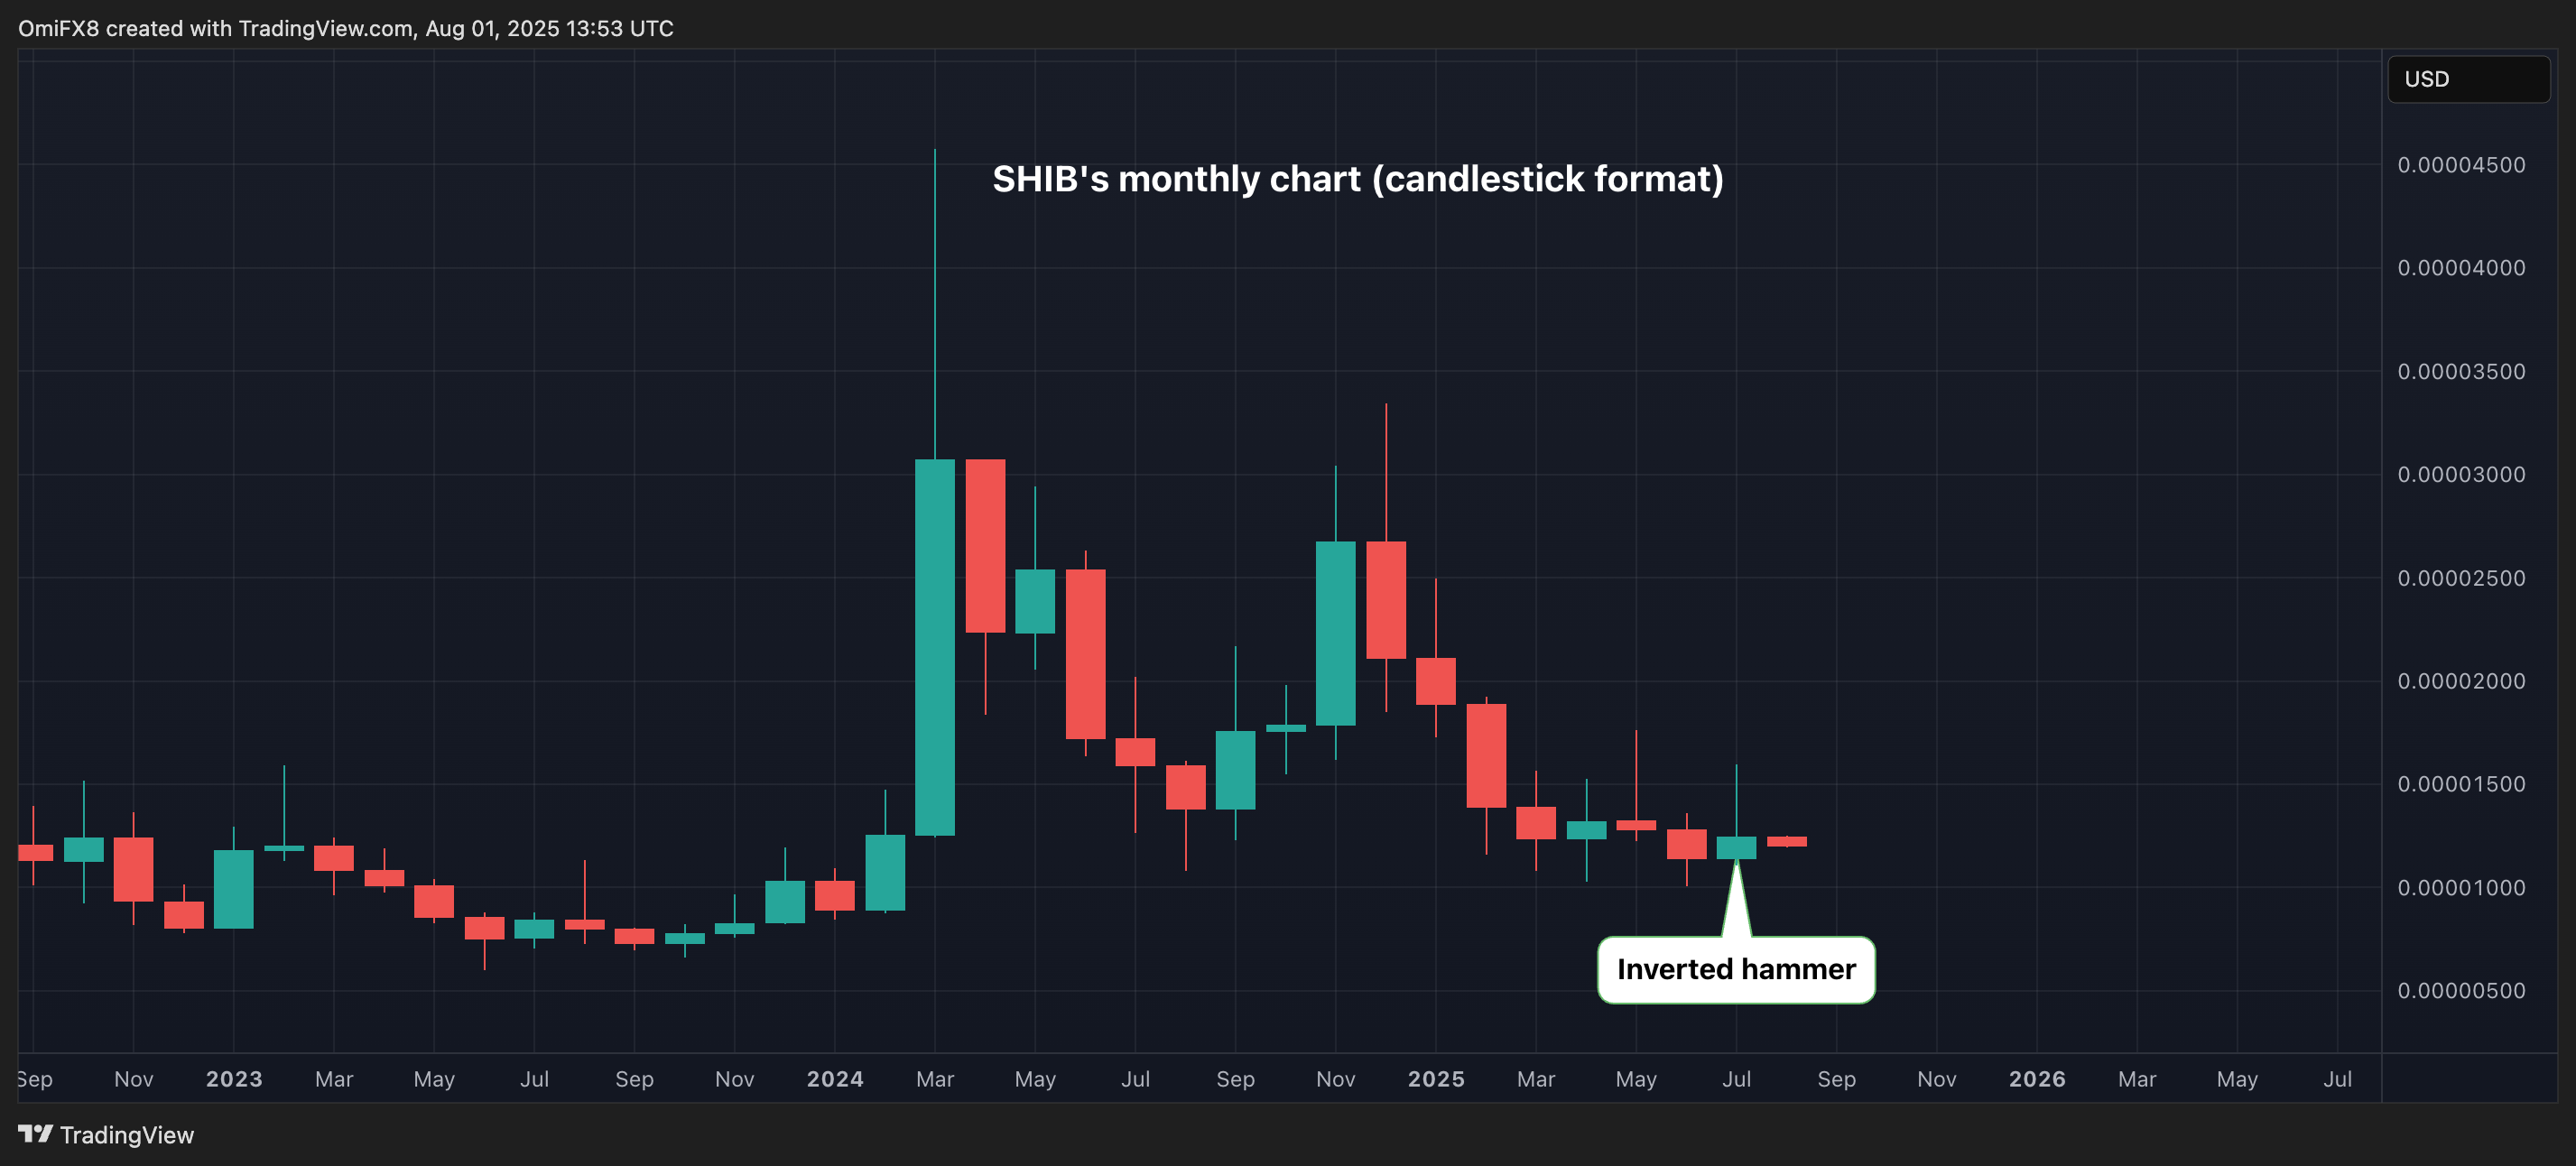
When the pattern appears after a notable downtrend, as in SHIB's case, it indicates that the bulls are looking to reassert themselves in the market. Hence, the pattern represents an early sign of an impending bullish trend reversal higher.
SHIB traders, however, need to note that a drop below the July low of $0.00001108 WOULD invalidate the bullish candlestick pattern.
