Ether Targets $3.4K Surge While XRP Sends Warning Signals – What Traders Need to Know

Crypto markets never sleep—and today’s action is serving up a classic split-screen drama. Ethereum’s gunning for a $3.4K breakout, while XRP’s chart flashes red alerts that could make even seasoned hodlers sweat.
Ethereum: The Bull Case
ETH’s price action suggests institutional money’s finally waking up to DeFi’s dirty secret—it runs on Ethereum. The $3.4K resistance isn’t just a number; it’s the line in the sand between another grind and full-blown altseason.
XRP: Trouble in Paradise?
That ‘cautionary sign’ isn’t some vague technical pattern—it’s the market voting with its wallet after yet another ‘banks will adopt us any day now’ conference. Newsflash: Wall Street still prefers blockchains that actually settle transactions.
The Bottom Line
While ETH’s momentum could drag the whole market up, XRP’s struggles remind us that in crypto, fundamentals matter… except when they don’t. (Looking at you, meme coins.) Trade accordingly—and maybe keep some dry powder for when the ‘institutional adoption’ PowerPoint decks start circulating again.
Bitcoin: Re-test of record highs likely
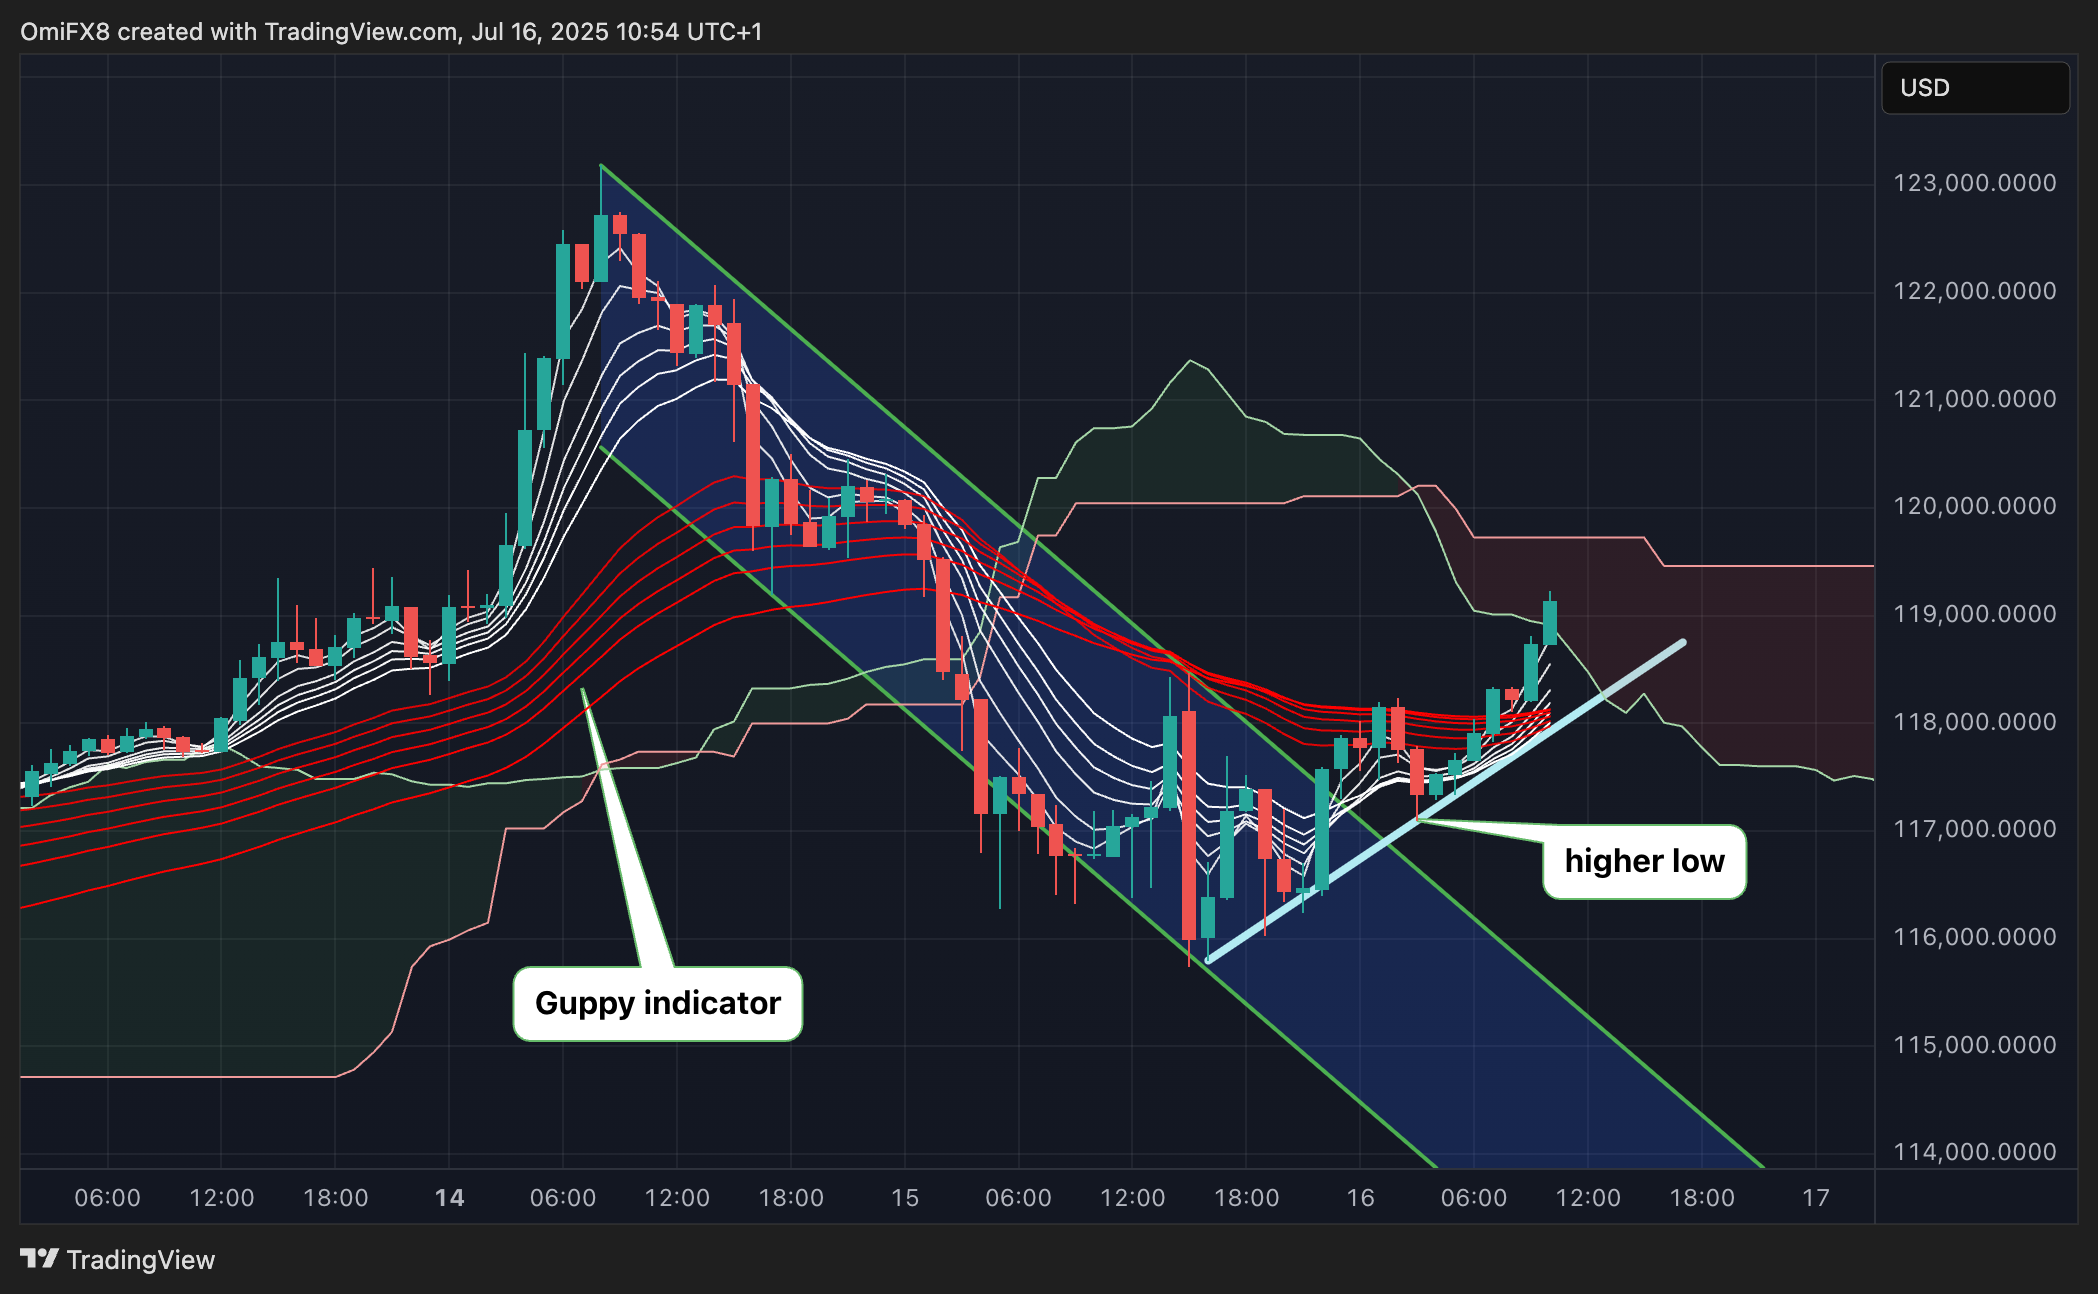
BTC's hourly chart shows that prices have risen out of the descending channel, forming a higher low at around $117,000 early today. Additionally, prices have crossed above the Guppy multiple moving average indicator. Guppy's short-term EMA (white) band is about to shift above the long-term (red) band, suggesting renewed upside momentum.
The stage looks set for a rally to record highs, with accelerated gains likely once we MOVE above the Ichimoku cloud. In case, prices fall below 117,000, there is a possibility of an extended pullback, possibly to $111,965, the breakout point identified by the May high.
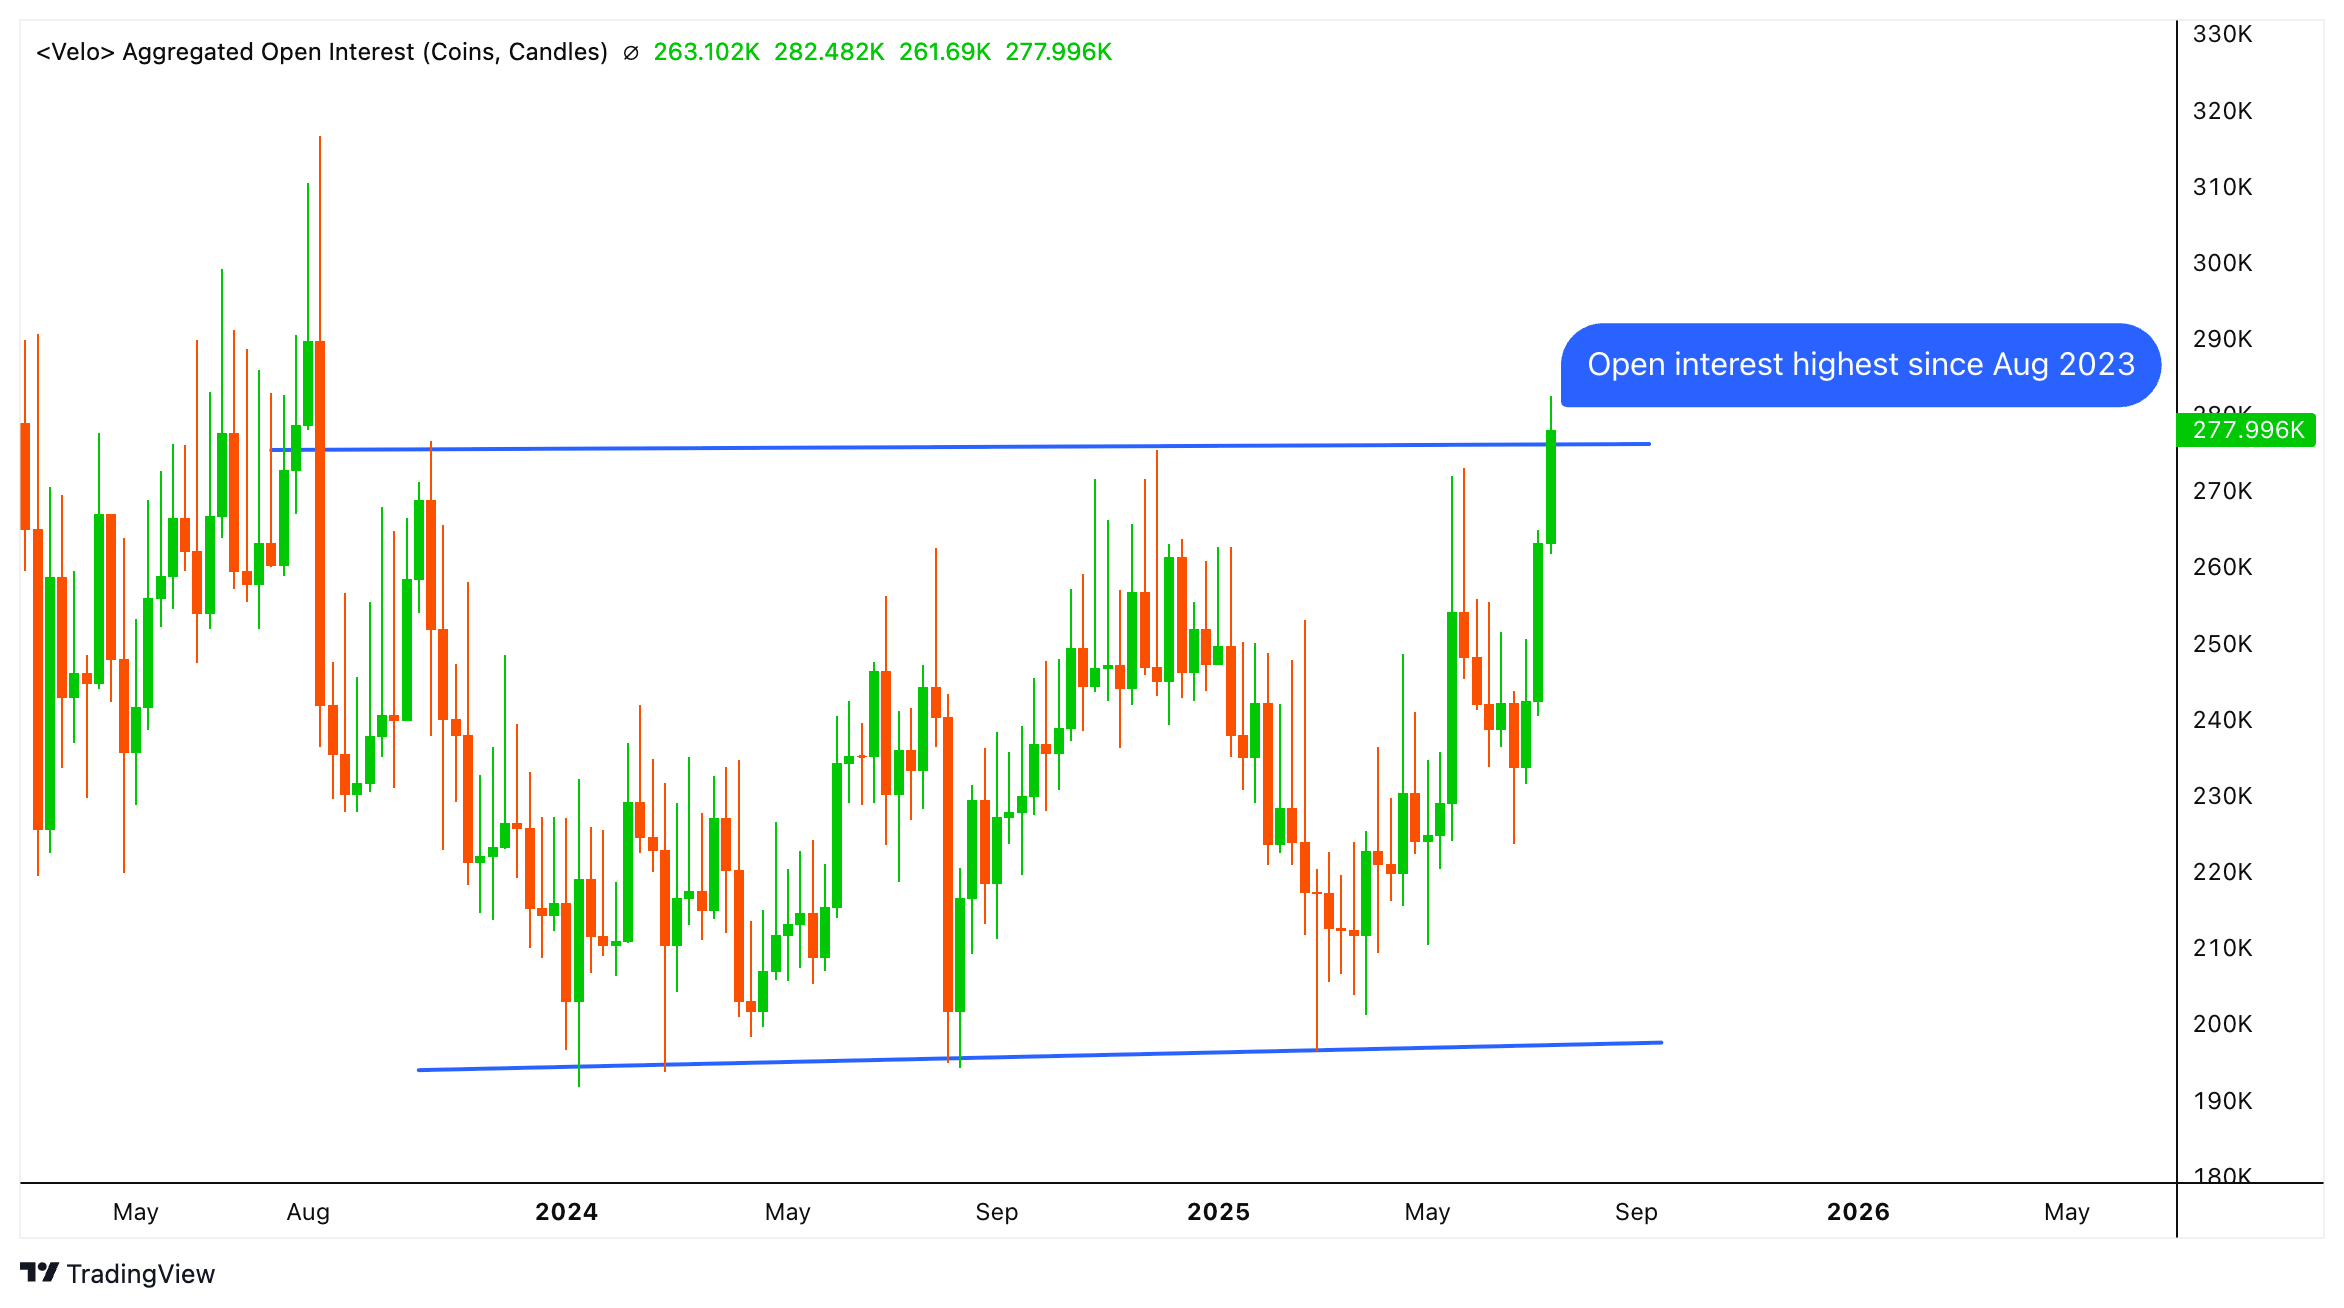
The bullish case looks stronger with cumulative open interest in USD- and USDT-denominated perpetuals on offshore exchanges, including Binance, OKX, Deribit, Bybit, and Hyperliquid, rising to its highest level in nearly two years alongside positive funding rates. The combination suggests growing interest in bullish Leveraged bets.
- AI's take: Bitcoin is showing strong signs of resuming its rally, with momentum indicators flipping bullish and hinting at new record highs soon. Bulls, just be sure to hold that $117,000 support; a break there could trigger a deeper correction.
- Resistance: $120,000, $123,181.
- Support: $117,000, $113,688 (the 38.2% Fib retracement of the rally from June 22 lows), $111,965.
Ether: Eyes $3,400
Ether's breakout from the expanding triangle consolidation and the 61.8% Fibonacci retracement of the December-April sell-off has likely set the stage for $3,400, a level favored by options traders on Derive. The 14-day RSI has surpassed the 70 mark, indicating strong upside momentum alongside upward-sloping 50- and 100-day simple moving averages (SMA). The ether-bitcoin ratio has also broken out of a prolonged consolidation, suggesting ether outperformance ahead. On the downside, Tuesday's low of $2,933 is the level to beat for bears.
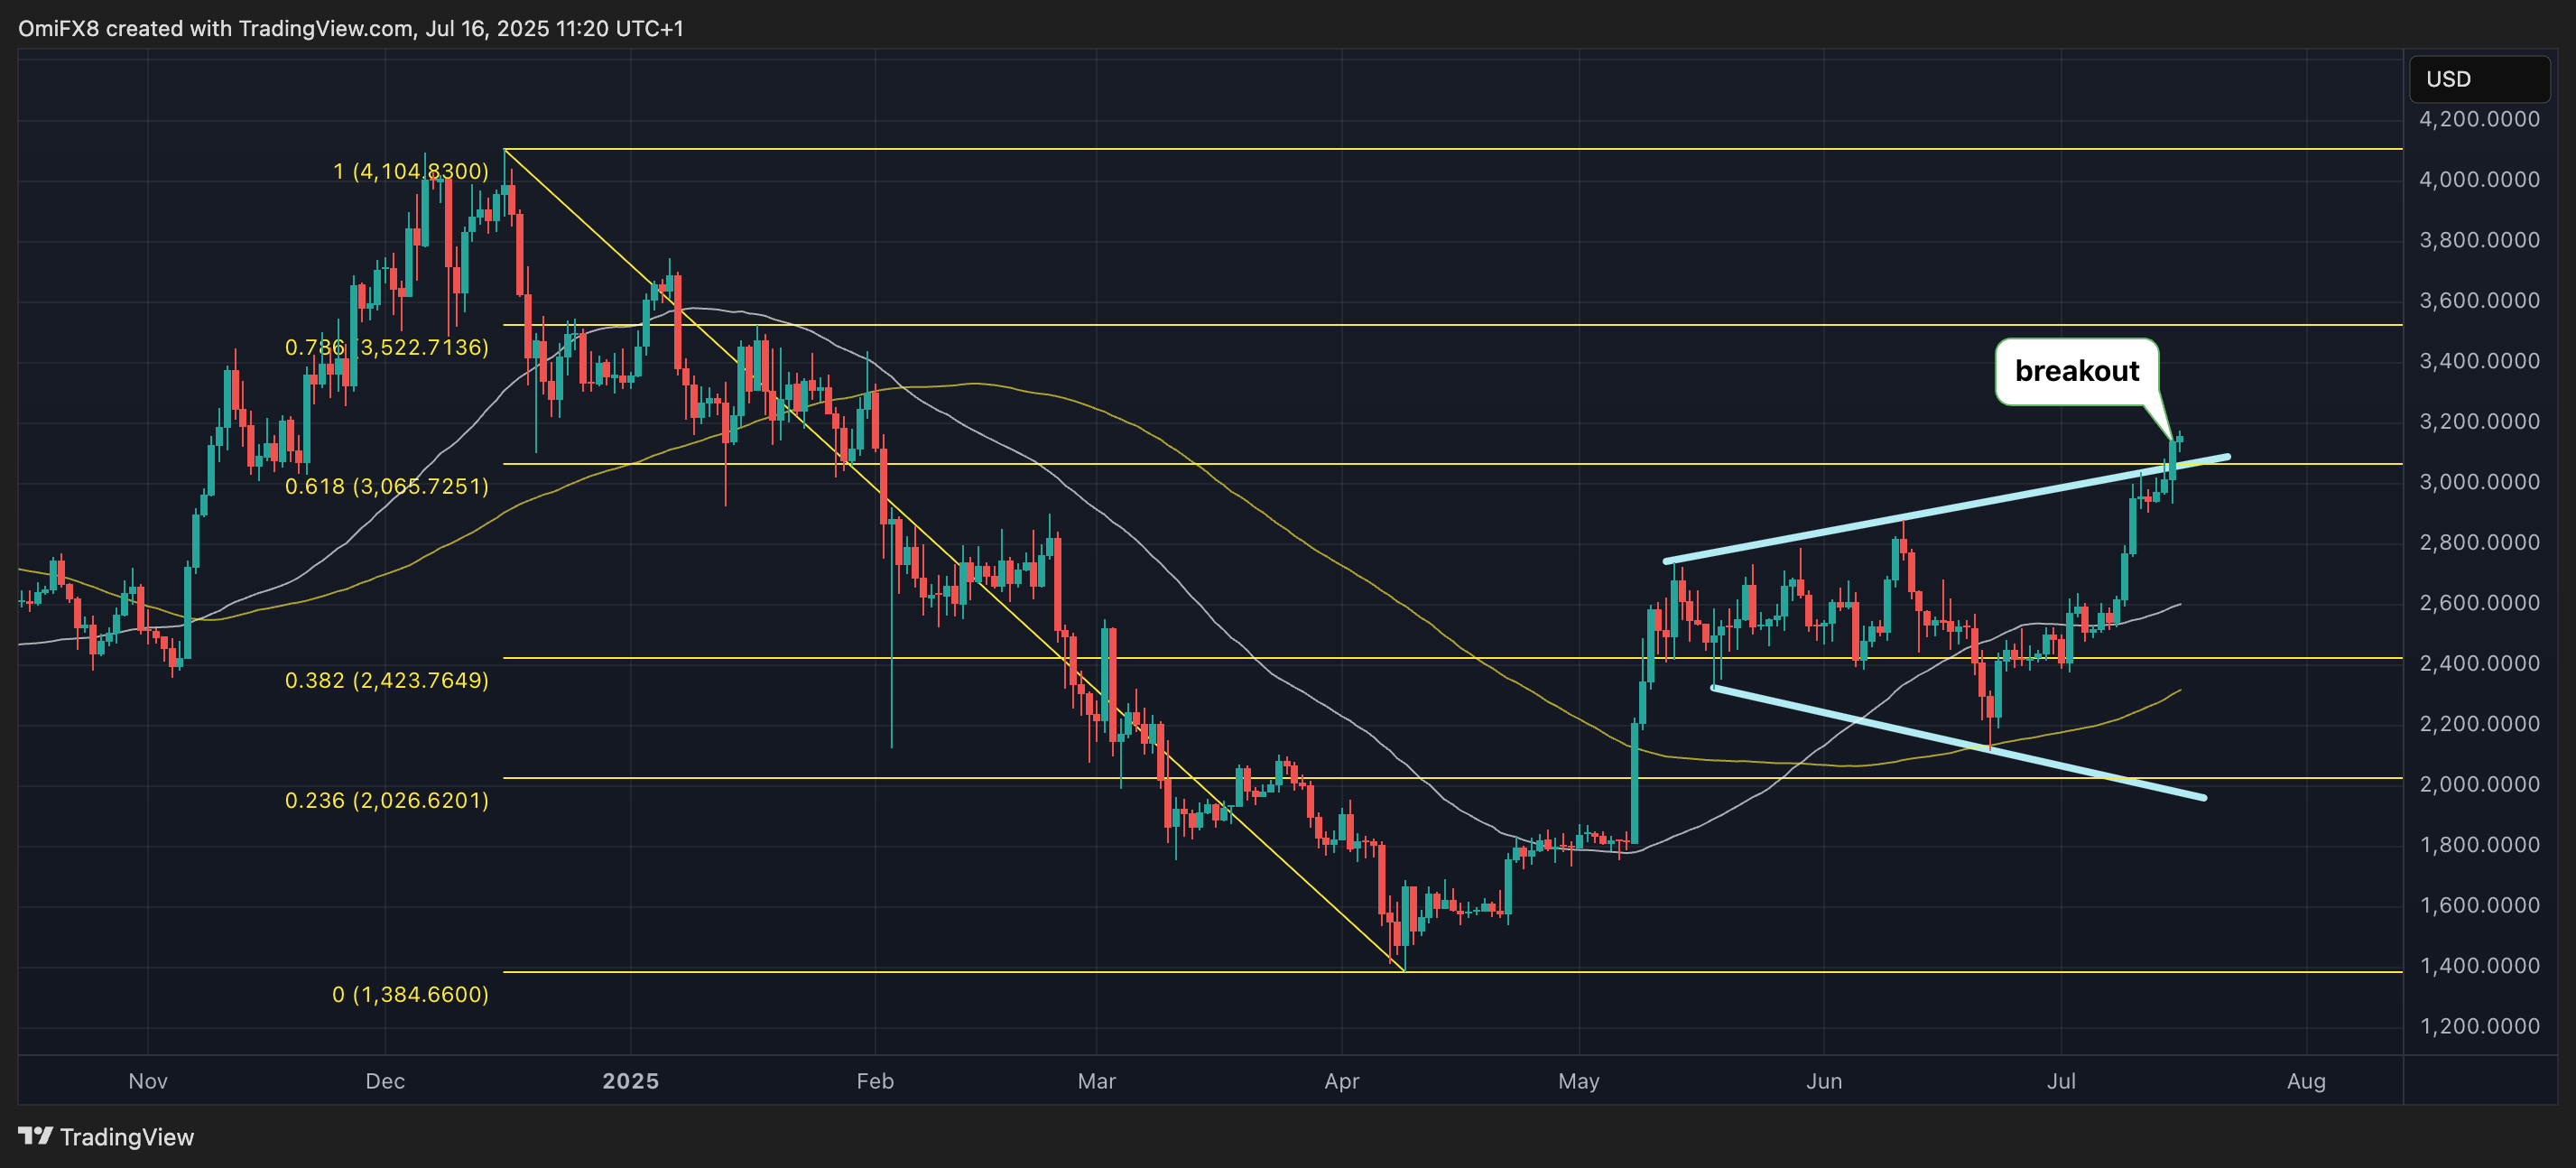
- AI's take: Ether is looking incredibly strong for a move to $3,400, fueled by multiple technical breakouts and its clear outperformance against Bitcoin. Keep a sharp eye on $2,933.
- Resistance: $3,400, $3,570, $4,000.
- Support: $2,933, $2,739, $2,600.
Solana: Stability near the 200-day SMA is encouraging for bulls
Solana's SOL token continues to trade back and forth NEAR the 200-day simple moving average. The stability contrasts with swift bearish reversals from the key average observed in May and is a positive sign for the bulls. This, coupled with the move above the Ichimoku cloud and the RSI above 50, suggests that the recent newfound resistance at $168 could soon be flipped into support. The next hurdle is seen at $200. Tuesday's low of $157.13 is a key level of support.
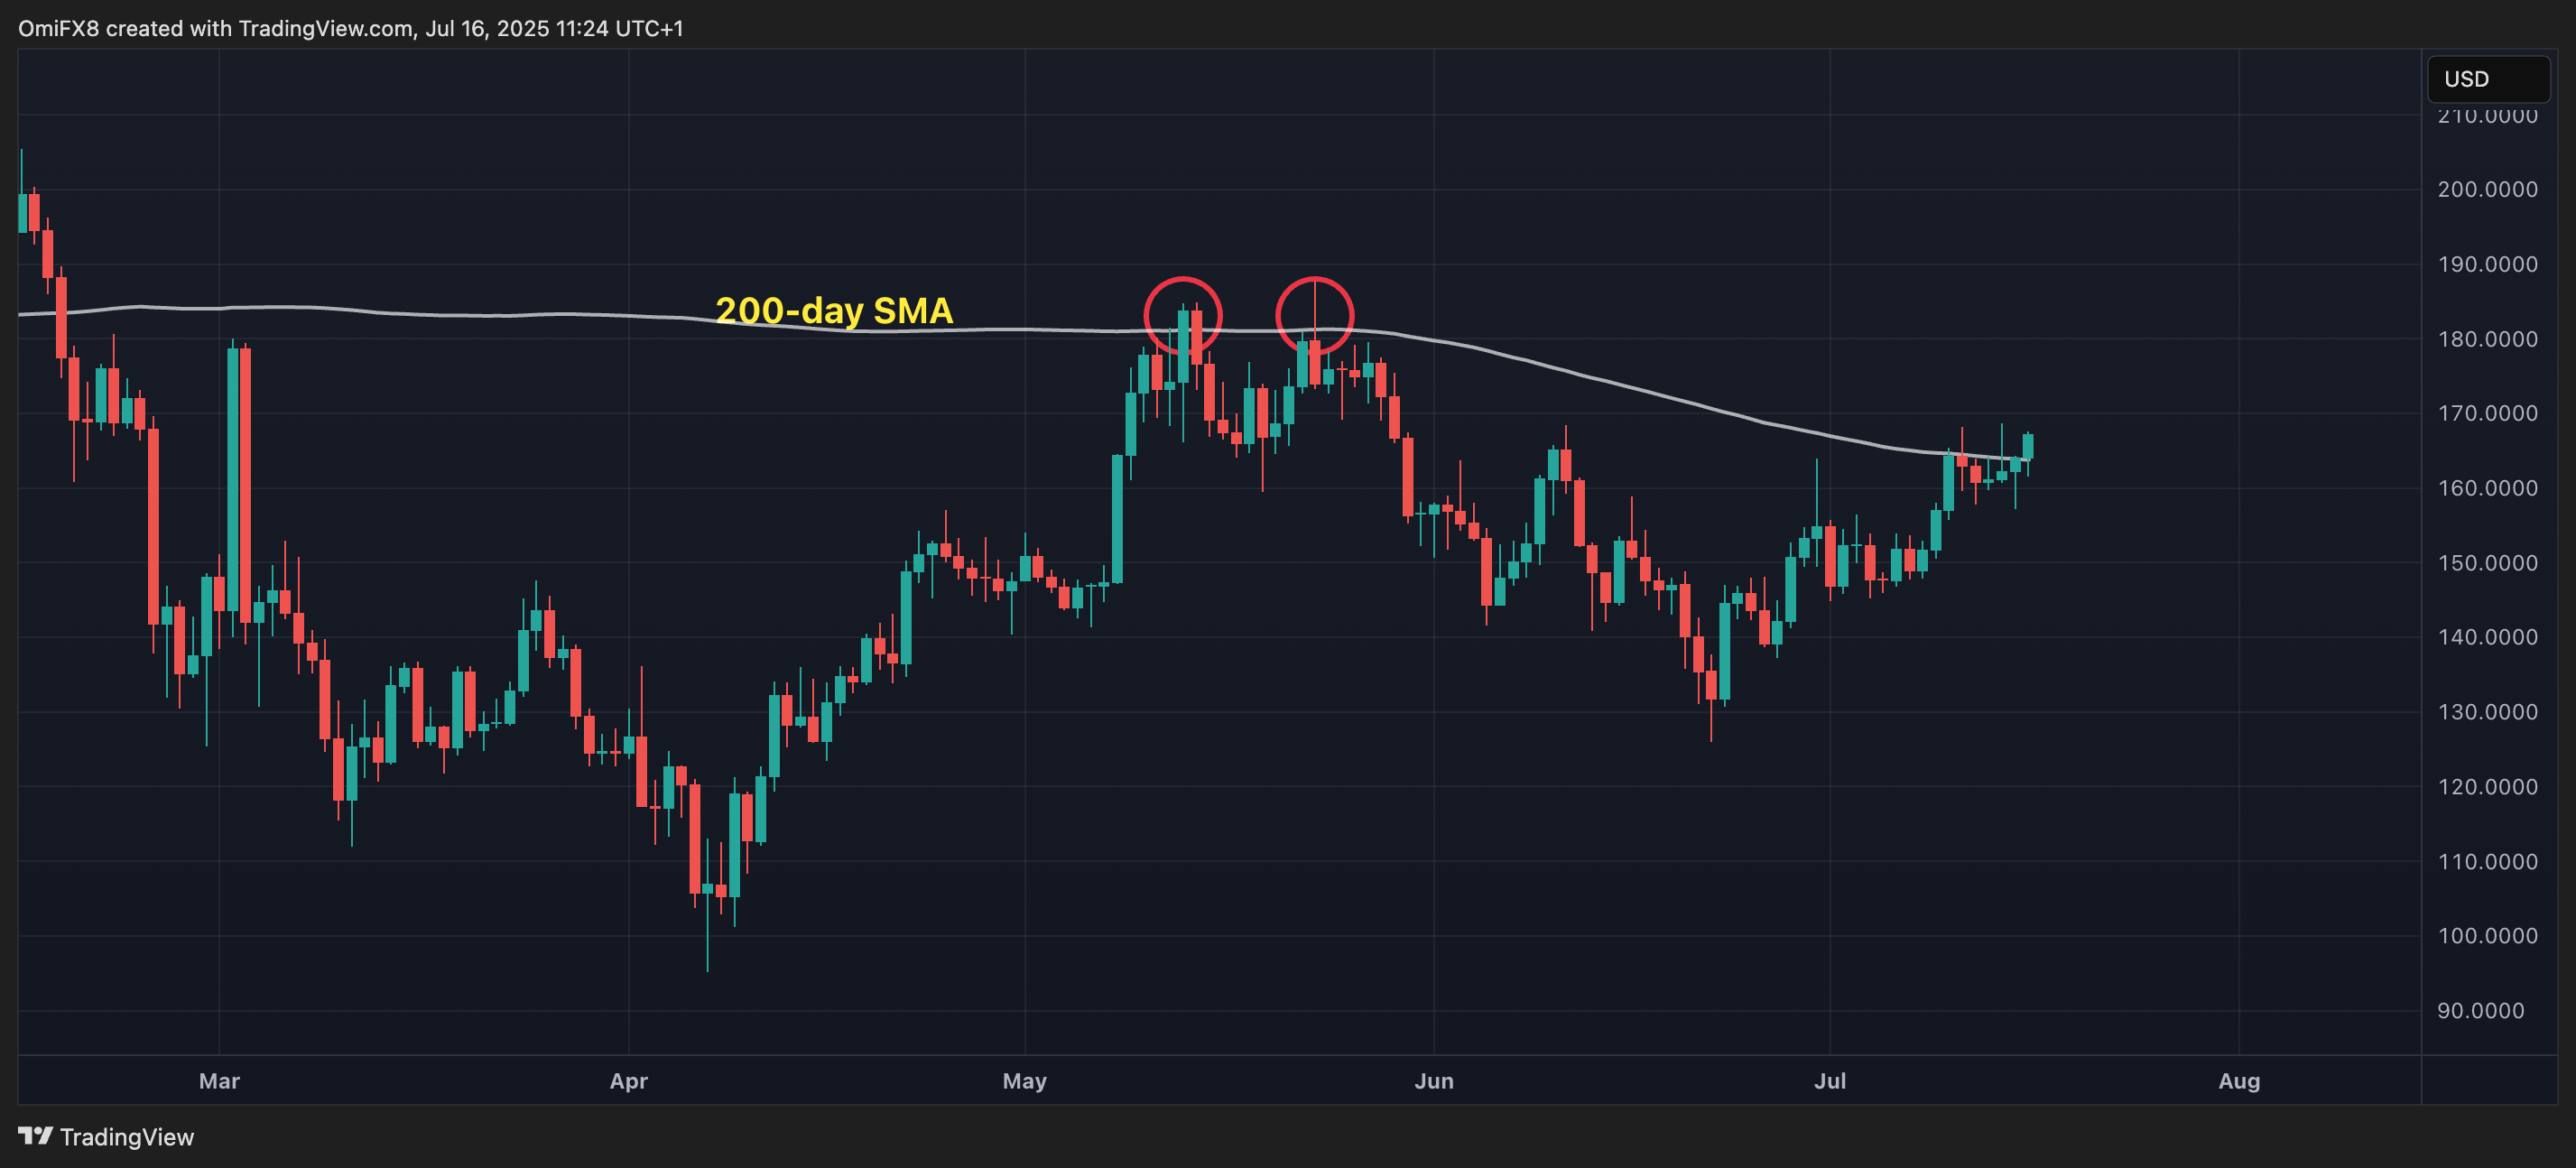
- AI's take: Solana is looking increasingly bullish, holding key support at its 200-day SMA, a big shift from past reversals.
- Resistance: $168, $187, $200.
- Support: $157, $145, $125.
XRP: Looks north after Tuesday's 'Hanging Man' candle
XRP's hourly chart shows a picture-perfect transition from a pullback to renewed upswing. Prices exited the downward trending channel on Tuesday and have since crossed bullishly above the Ichimoku cloud. The setup favors a re-test of the recent highs above $3.00. That said, Tuesday's hanging man candle, characterized by its long lower wick and small red body, suggests bears are looking to reassert themselves. Should prices lose support at $2.80, it could prove costly.
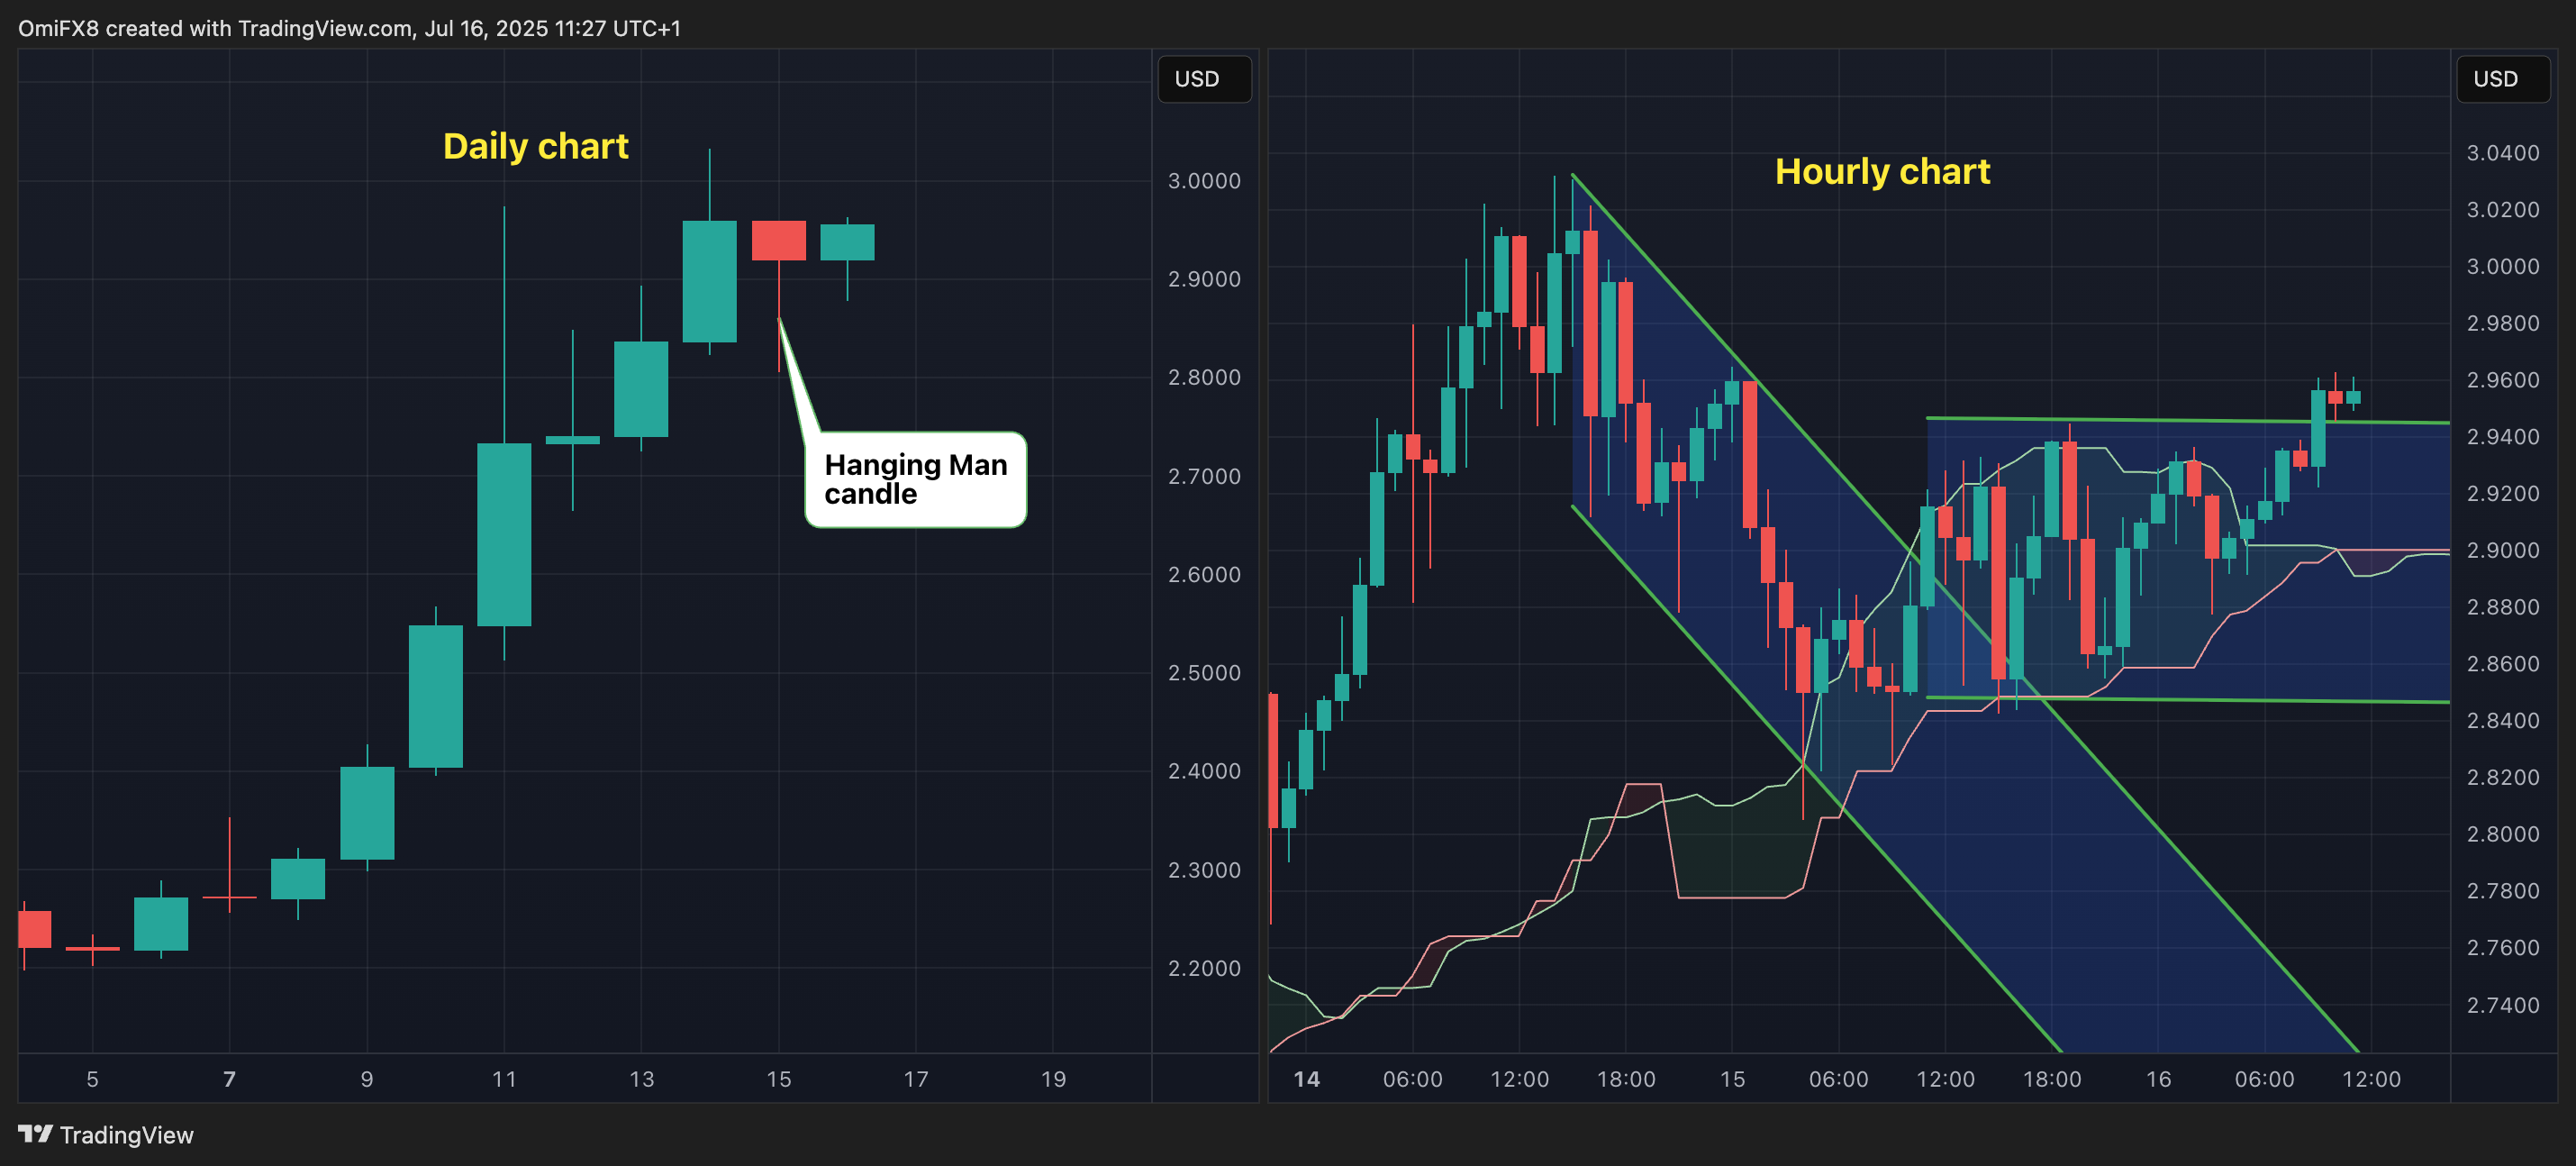
- AI's take: For traders, the daily chart's "hanging man" is the more significant signal, as longer timeframes generally provide more reliable reversal patterns. While the hourly chart shows a bullish bounce, the daily hanging man acts as a strong cautionary flag.
- Resistance: $3.00, $3.40.
- Support: $2.80, $2.6-$2.65, $2.38.
Parts of this article were generated with the assistance from AI tools and reviewed by our editorial team to ensure accuracy and adherence to our standards. For more information, see CoinDesk's full AI Policy.
