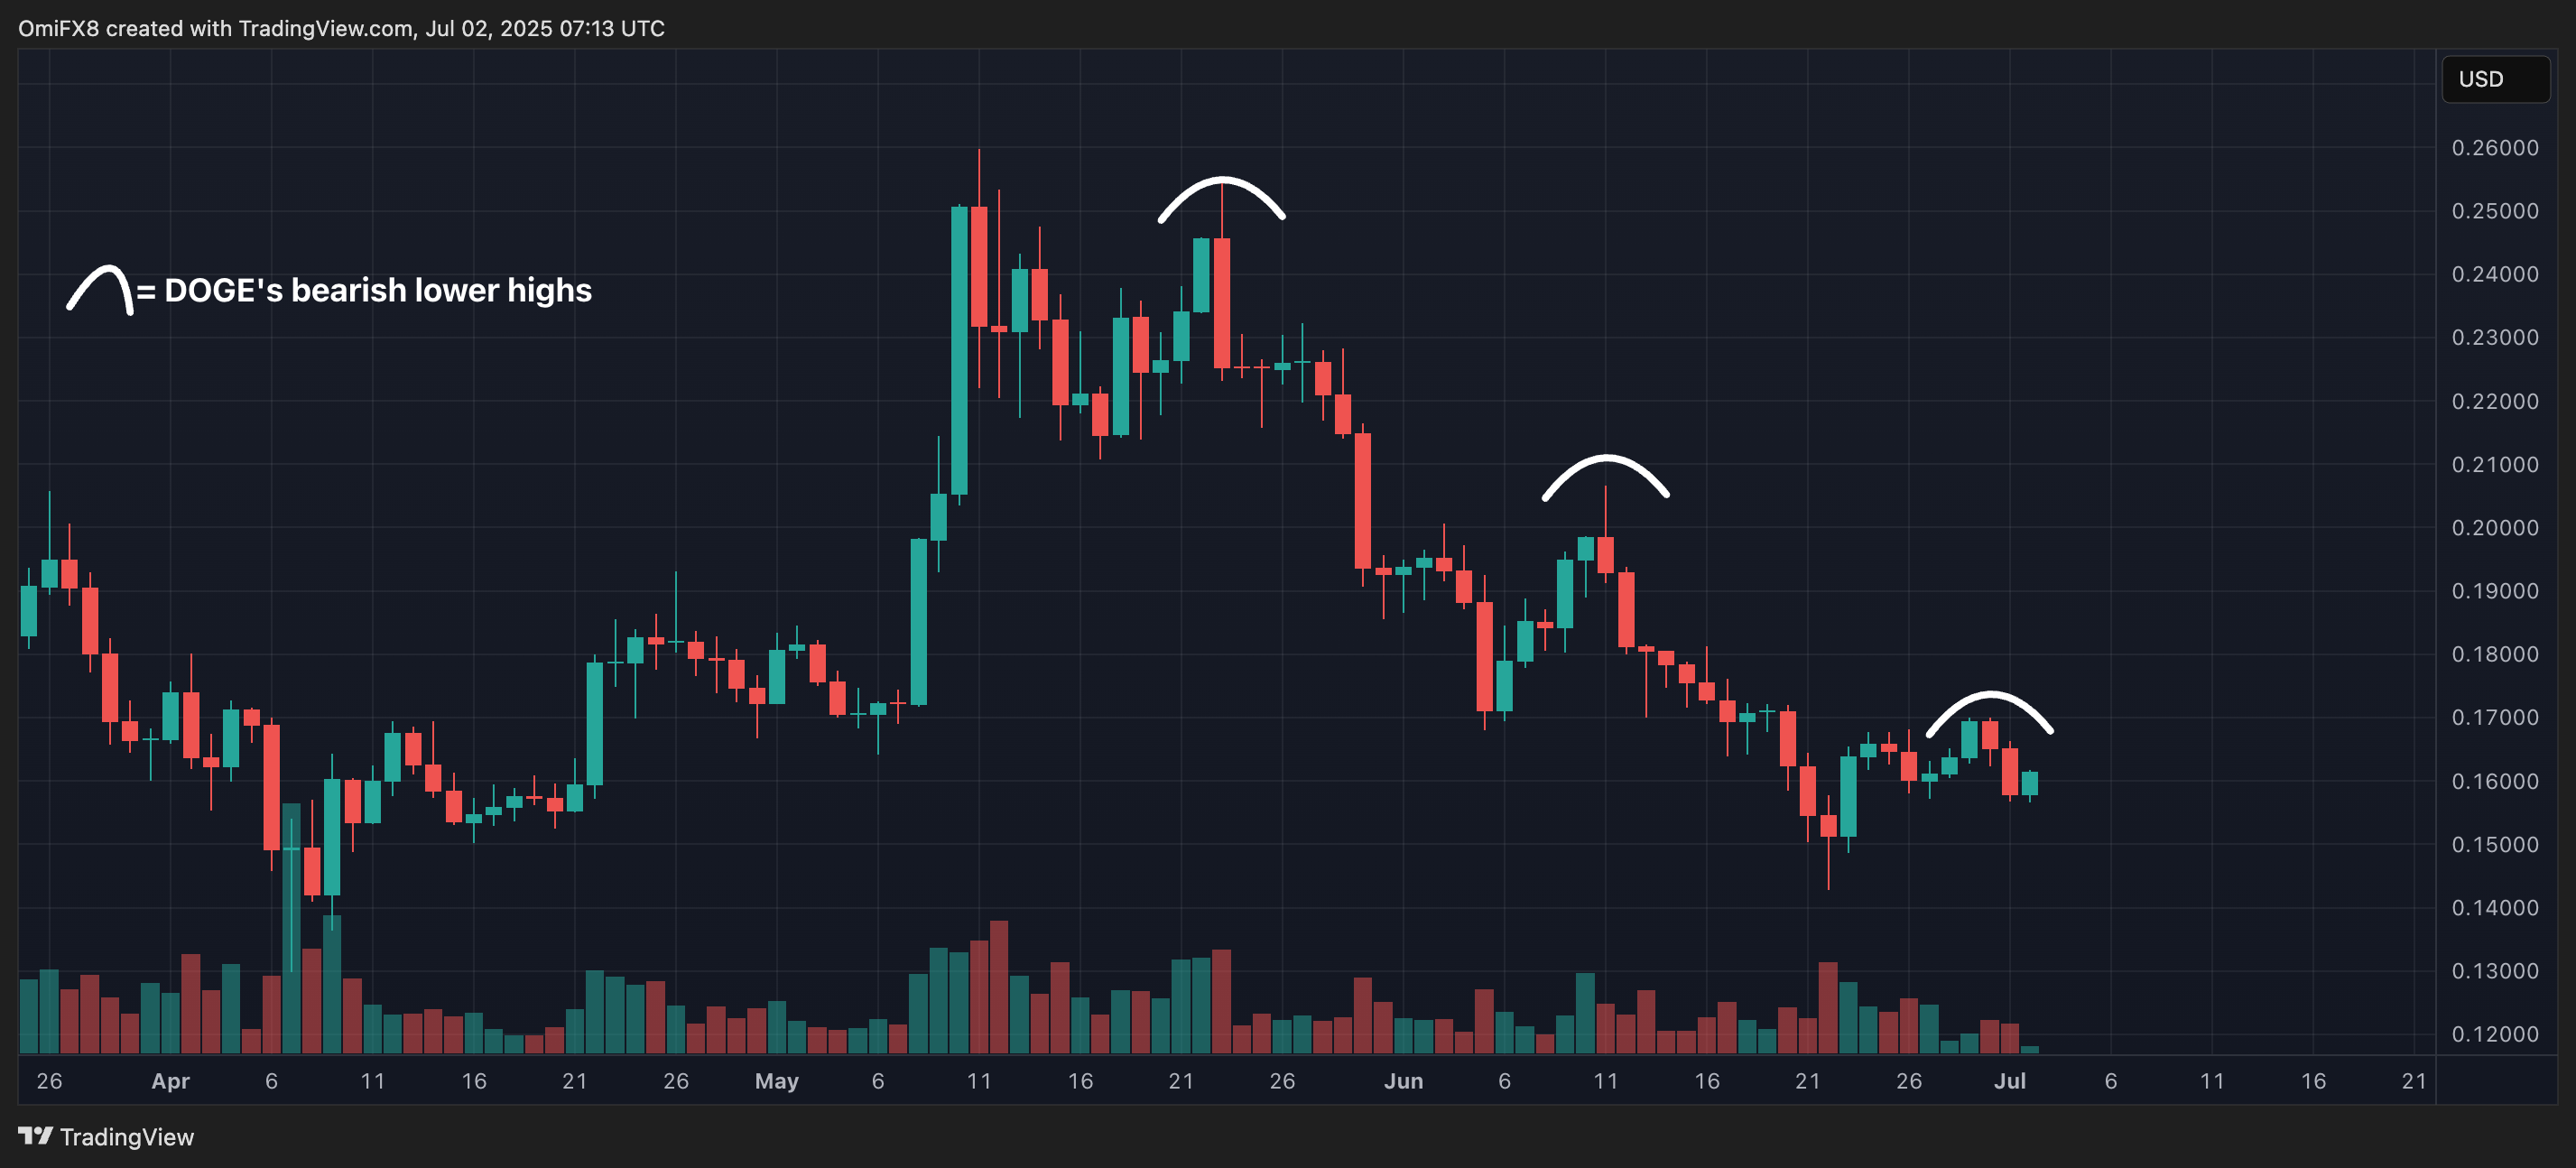
Dogecoin Stages Comeback: Double Bottom Pattern Sparks Bullish Rally
Dogecoin defies the skeptics—again—with a textbook technical rebound.
The meme coin's latest price action paints a classic 'double bottom' pattern, a bullish reversal signal that's got traders scrambling back in. No fundamentals? No problem. When has that ever stopped crypto?
Key levels to watch: If DOGE holds above the neckline, we could see a 30% pump within days. But let's be real—this is Dogecoin we're talking about. The only thing more predictable than its volatility is Wall Street 'experts' claiming they saw it coming.
Pro tip: Watch the BTC pairing. If Bitcoin stabilizes, DOGE could ride the momentum wave straight to 'to the moon' memes—until the next whale decides to cash out.

Key AI insights
- DOGE formed a clear double bottom pattern around the $0.157-$0.158 zone, with above-average volume, particularly during the 13:00-14:00 hours on July 1.
- The cryptocurrency experienced a steady climb culminating in a bullish close at $0.161, with increasing volume confirming buyer interest.
- In the last 60 minutes from July 2, 05:37 to 06:36, DOGE demonstrated a clear bullish trend, rising from $0.1605 to $0.1611, representing a 0.36% gain.
- Price action formed an ascending channel, with notable volume spikes at 06:06 and 06:07 (over 4.4M and 6.0M respectively), confirming strong buyer interest.
- After reaching a local high of $0.1611 at 06:14, DOGE experienced a brief pullback to $0.1606 at 06:27 before recovering to close the hour at $0.1611.

