Bitcoin’s $100K Breakout Isn’t Another January Flash in the Pan – Here’s Why

Forget the January pump-and-dump déjà vu. This rally’s got legs—and the charts prove it.
The whale difference: Institutional inflows are stacking sats like never before, not just retail FOMO.
Volume doesn’t lie: Real money’s changing hands this time, not just leverage-happy degens playing with futures.
Macro tailwinds: While traditional markets wobble, BTC’s eating their lunch as the ultimate hedge (take that, goldbugs).
One cynical aside? Wall Street’s still trying to front-run the ETF they’ll inevitably approve... three years late and 100% self-serving.
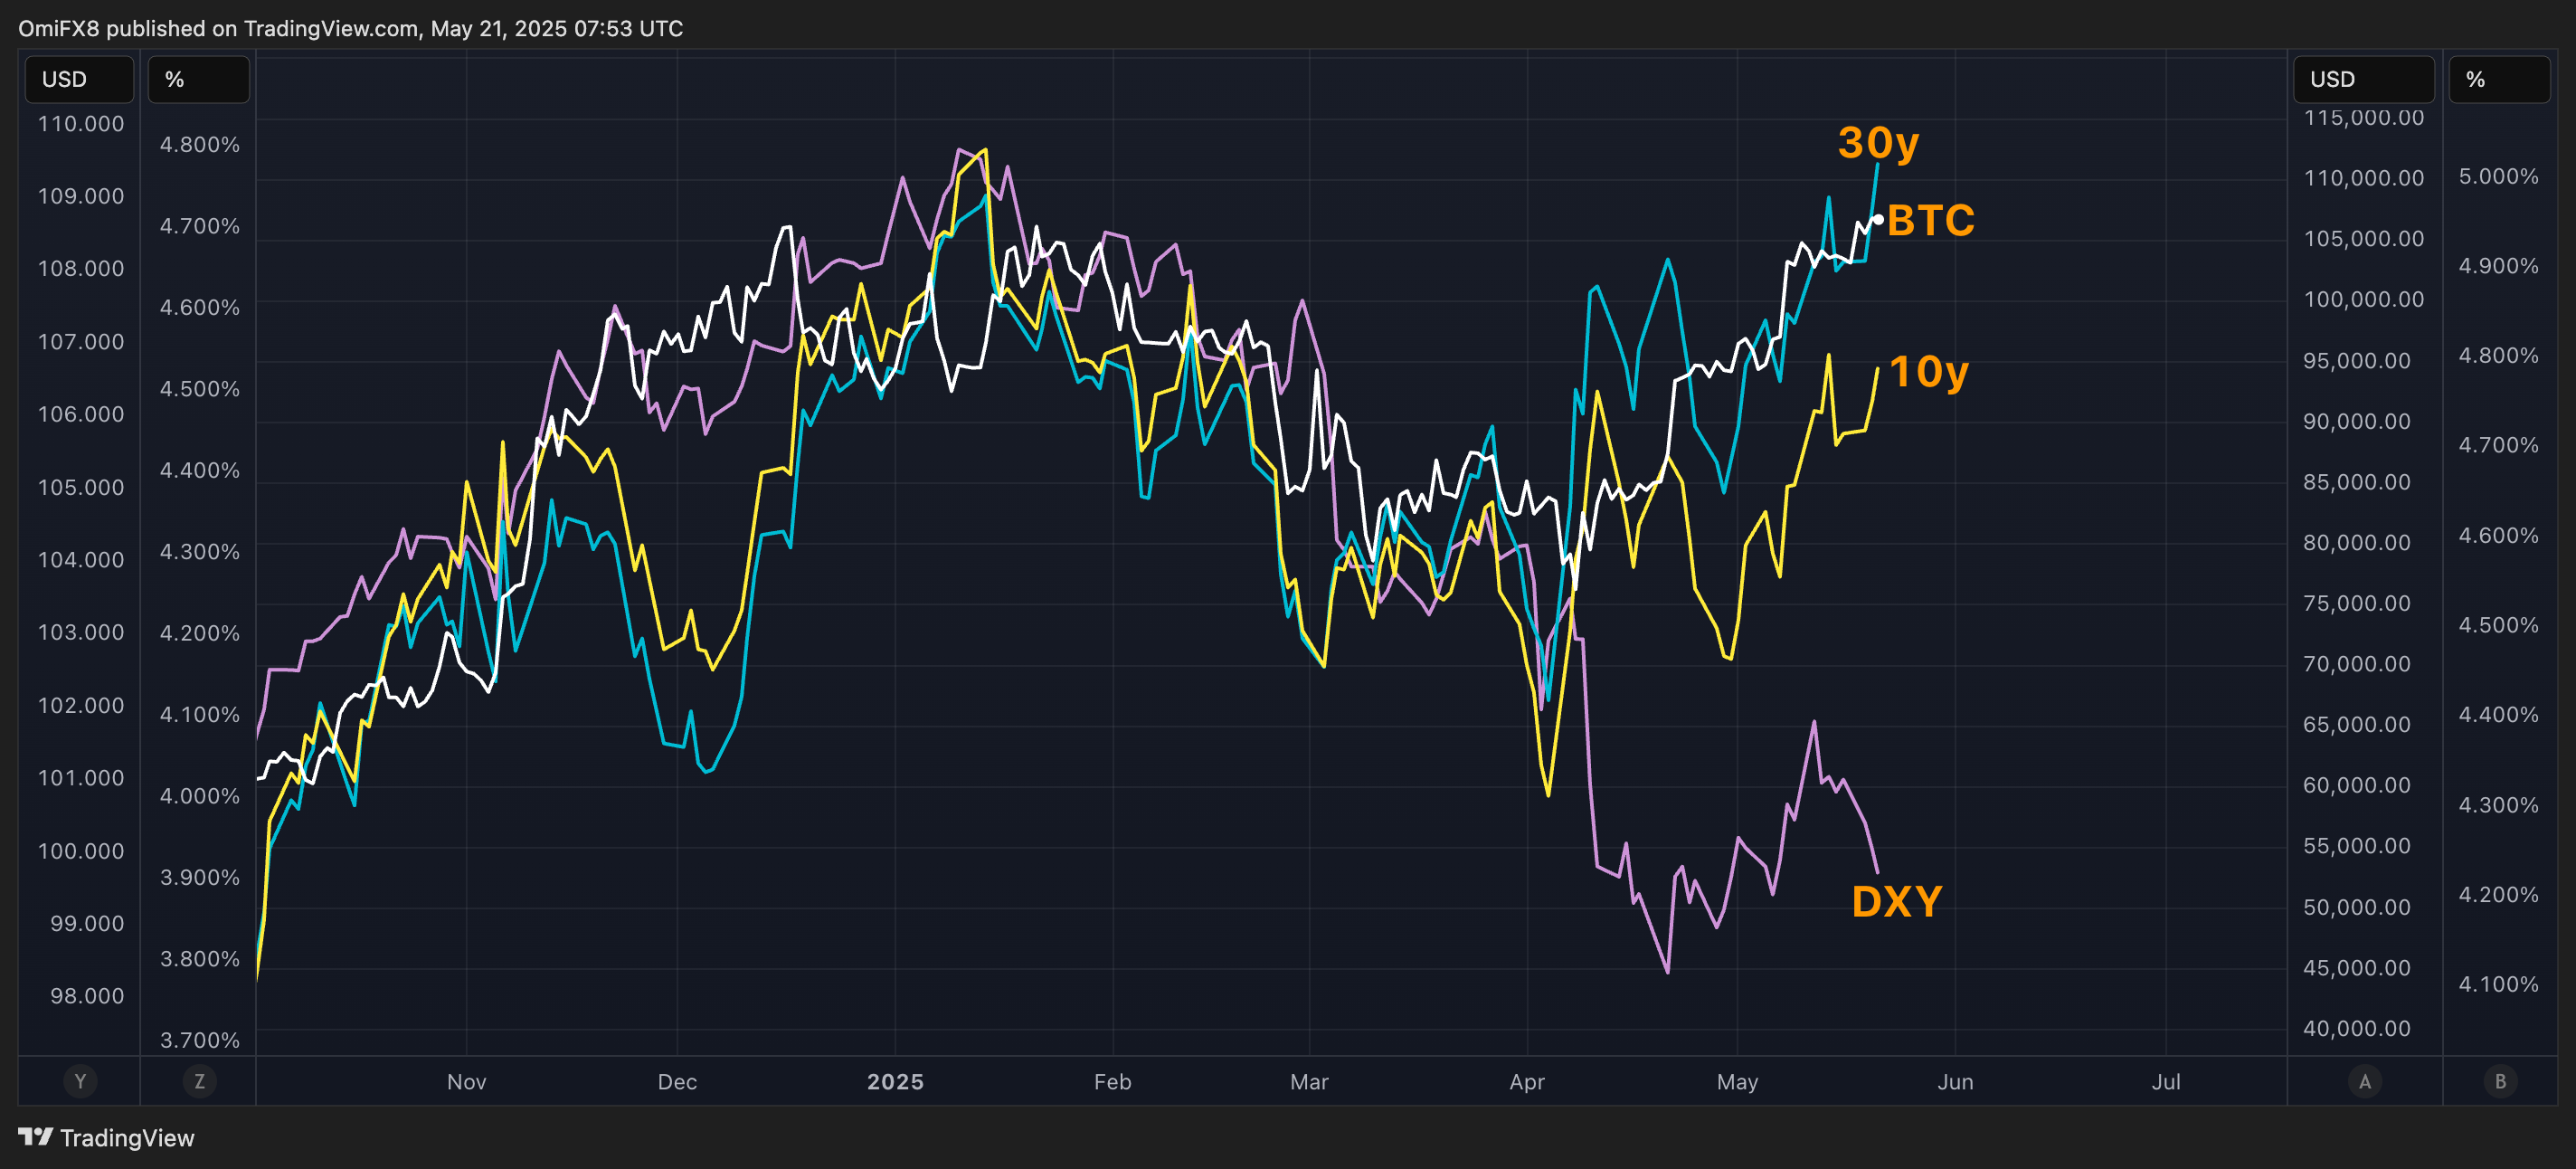
At press time, the dollar index, which measures the greenback’s value against major currencies, stood at 99.60, down 9% from highs above 109.00 in January. The yield on the U.S. 10-year Treasury note stood at 4.52%, down 30 basis points from the high of 4.8% in January.
The 30-year yield has risen above 5%, revisiting levels seen in January, but is largely seen as positive for bitcoin and gold.
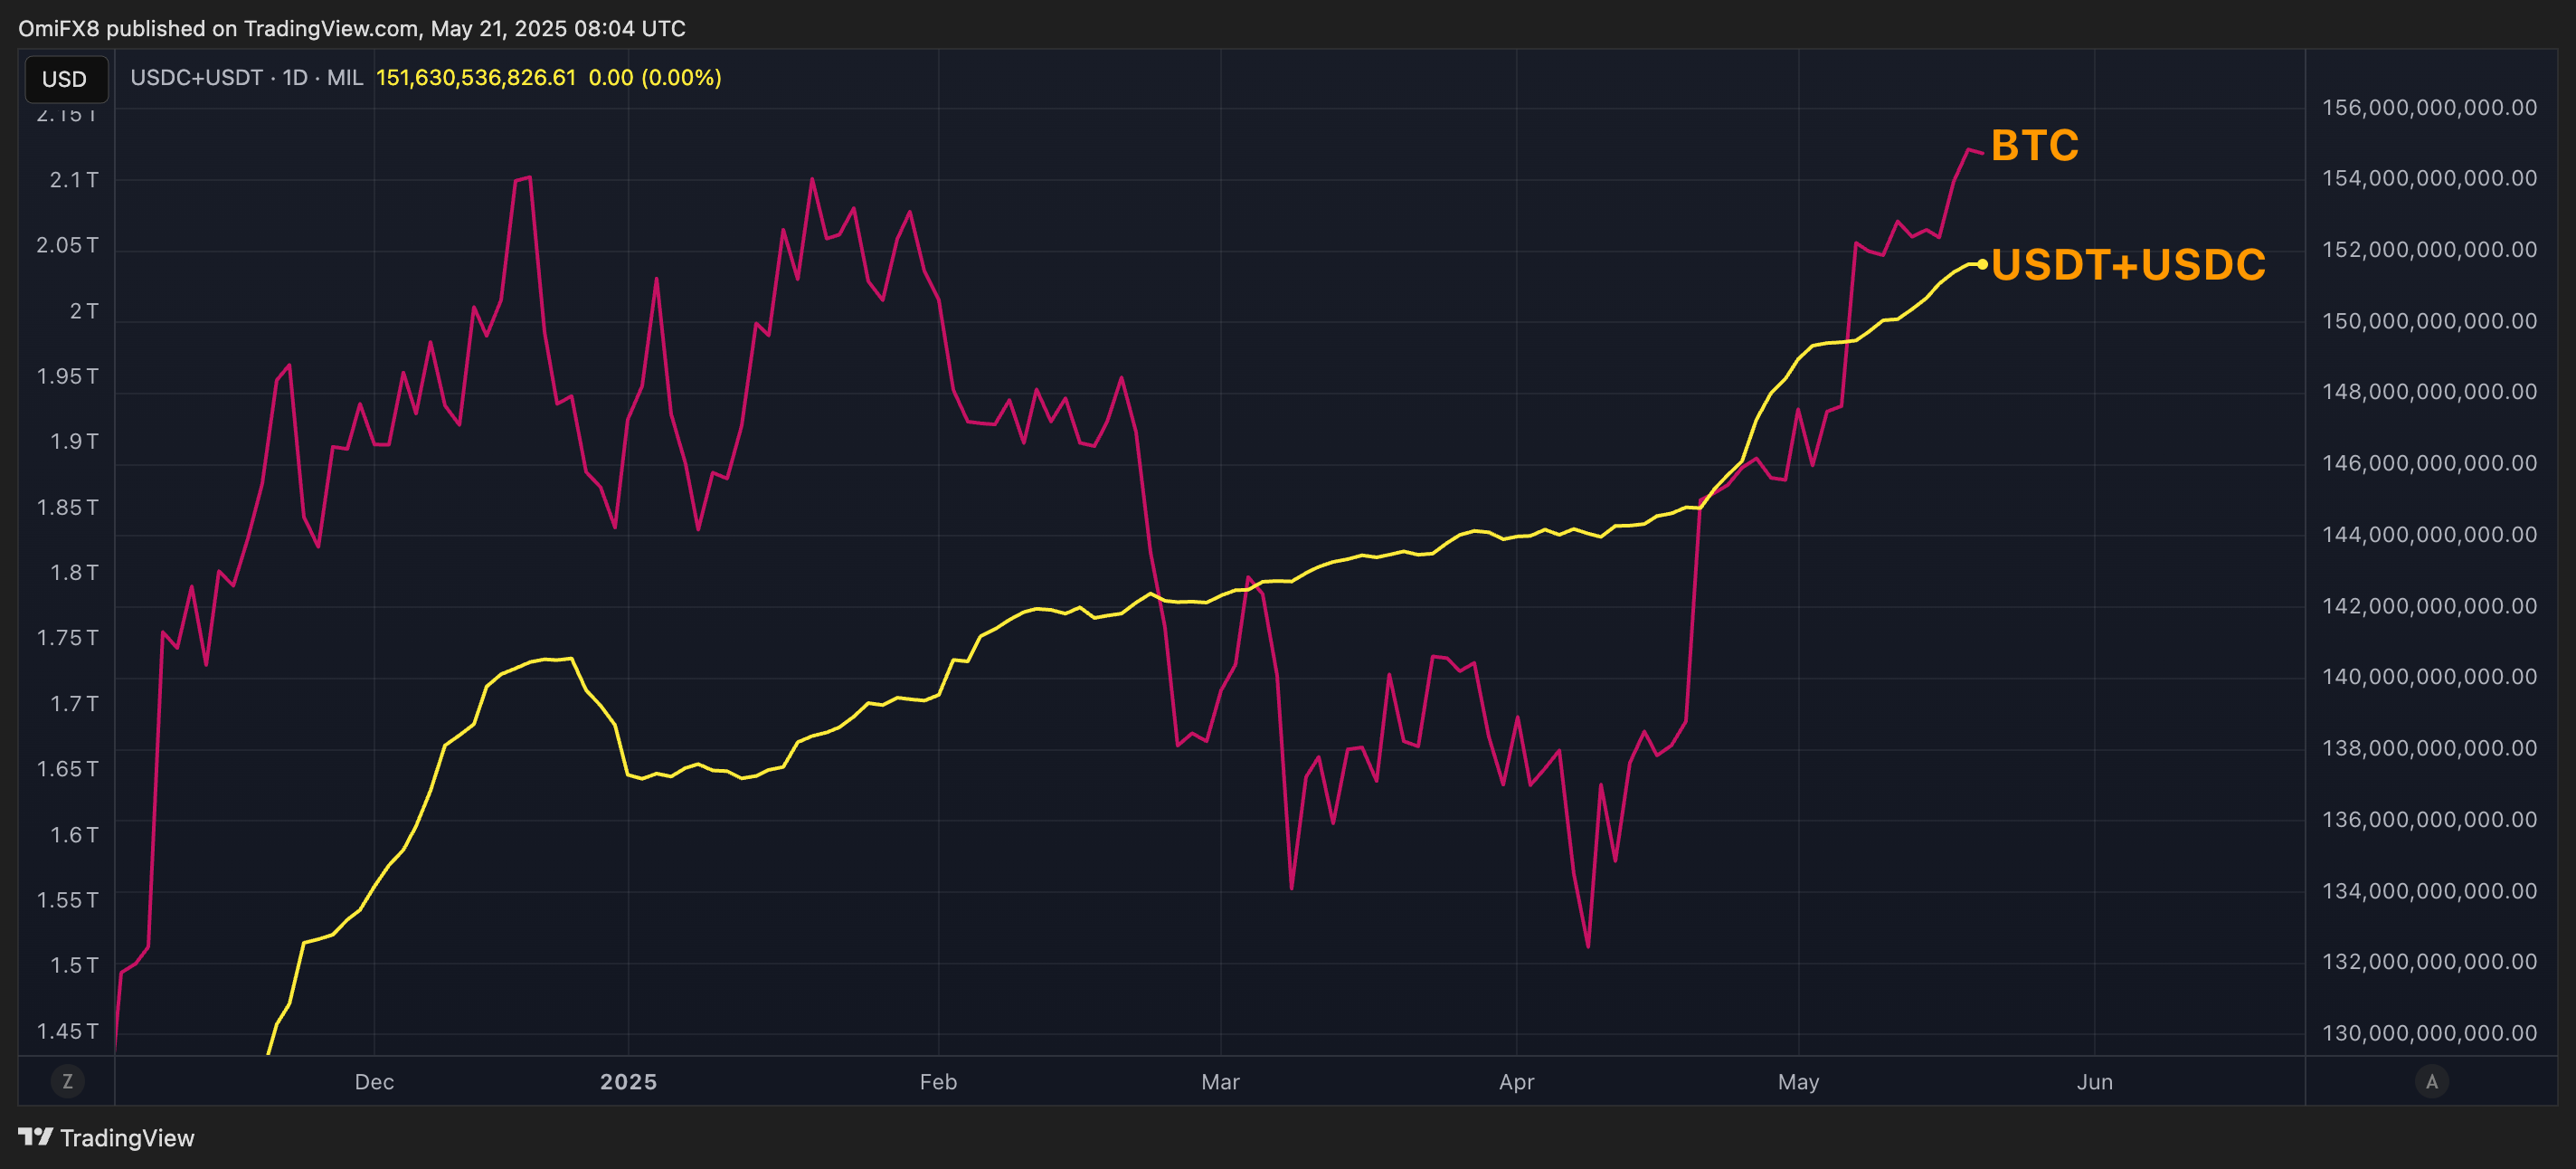
More dry powderThe combined market capitalization of the top two USD-pegged stablecoins, USDT and USDC, has reached a record high of $151 billion. That’s nearly 9% higher than the average $139 billion in December-January, according to data source TradingView.
In other words, a greater amount of dry powder is now available for potential investments in bitcoin and other cryptocurrencies.
BTC’s run higher from early April lows NEAR $75,000 is characterized by institutions predominantly taking bullish directional bets rather than arbitrage bets.
That’s evident by the booming inflows into the U.S.-listed spot bitcoin exchange-traded funds (ETFs) and the still subdued open interest in the CME BTC futures.
According to data source Velo, the notional open interest in the CME Bitcoin futures has jumped to $17 billion, the highest since Feb. 20. Still, it remains well below the December high of $22.79 billion.
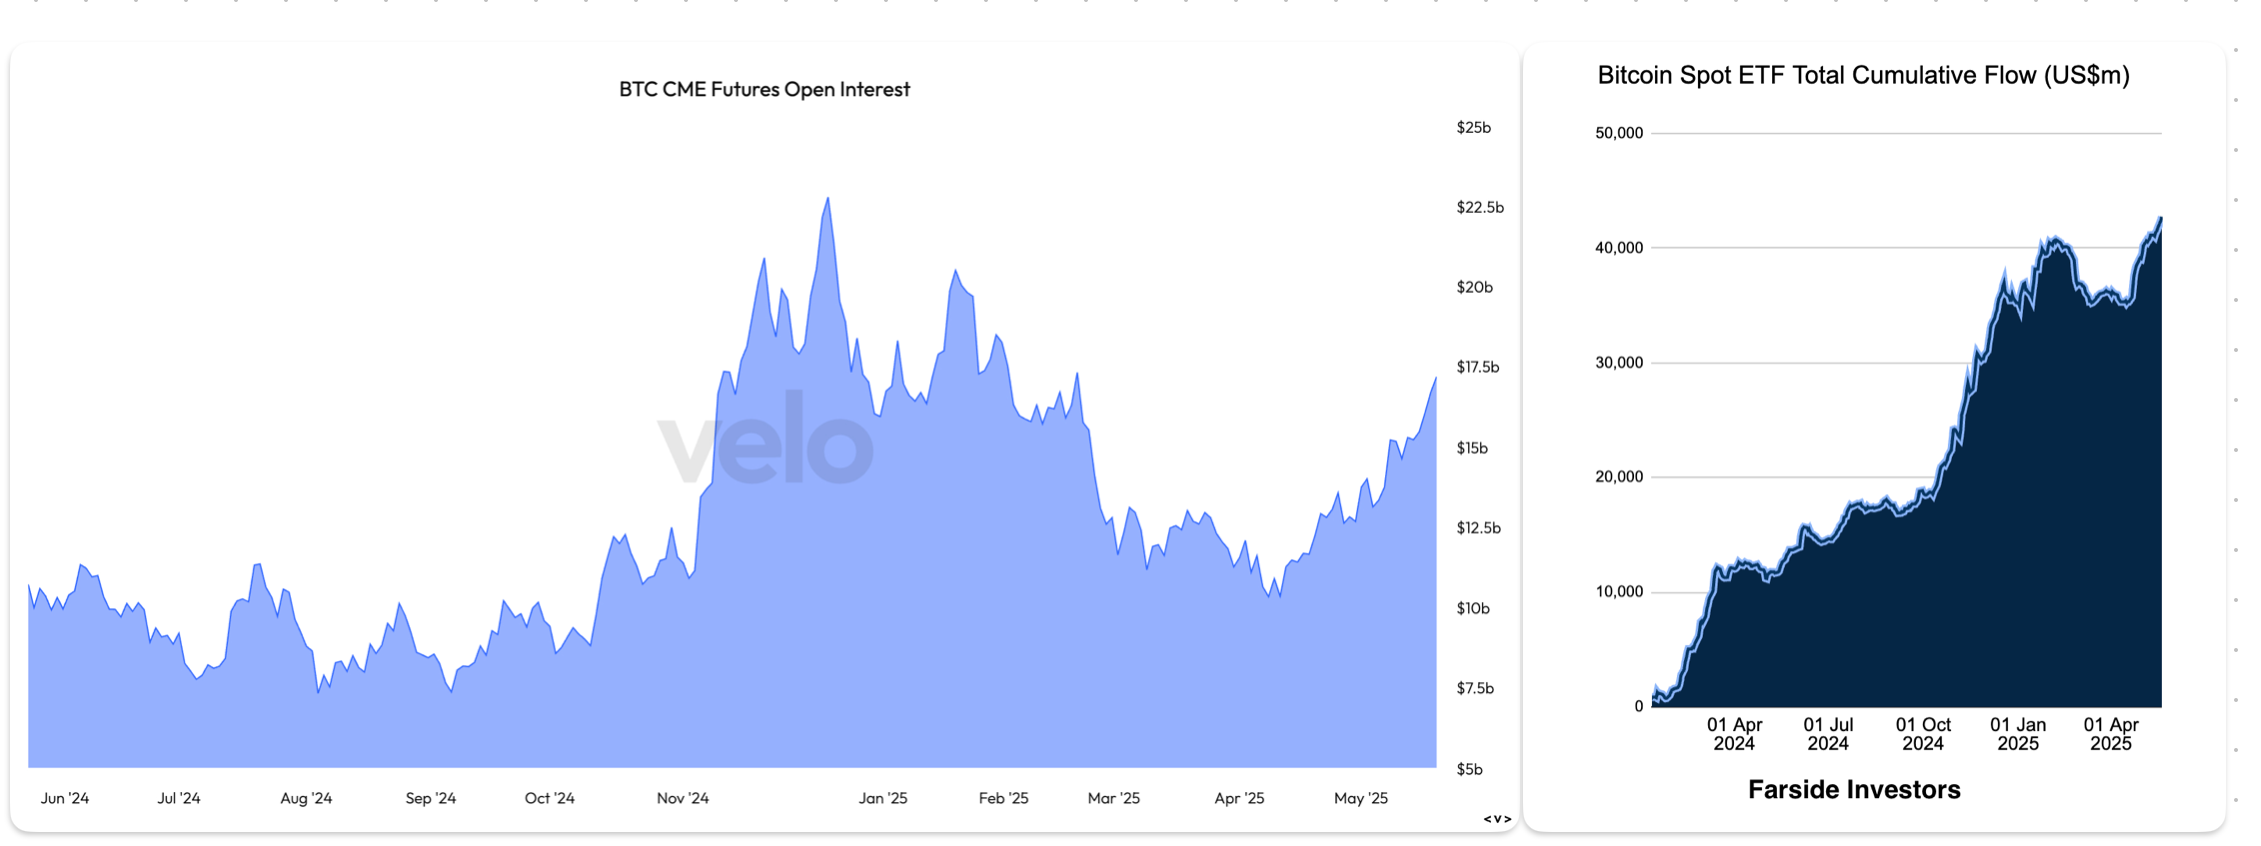
On the contrary, the cumulative inflows into the 11 spot ETFs now stand at a record $42.7 billion versus $39.8 billion in January, according to data source Farside Investors.
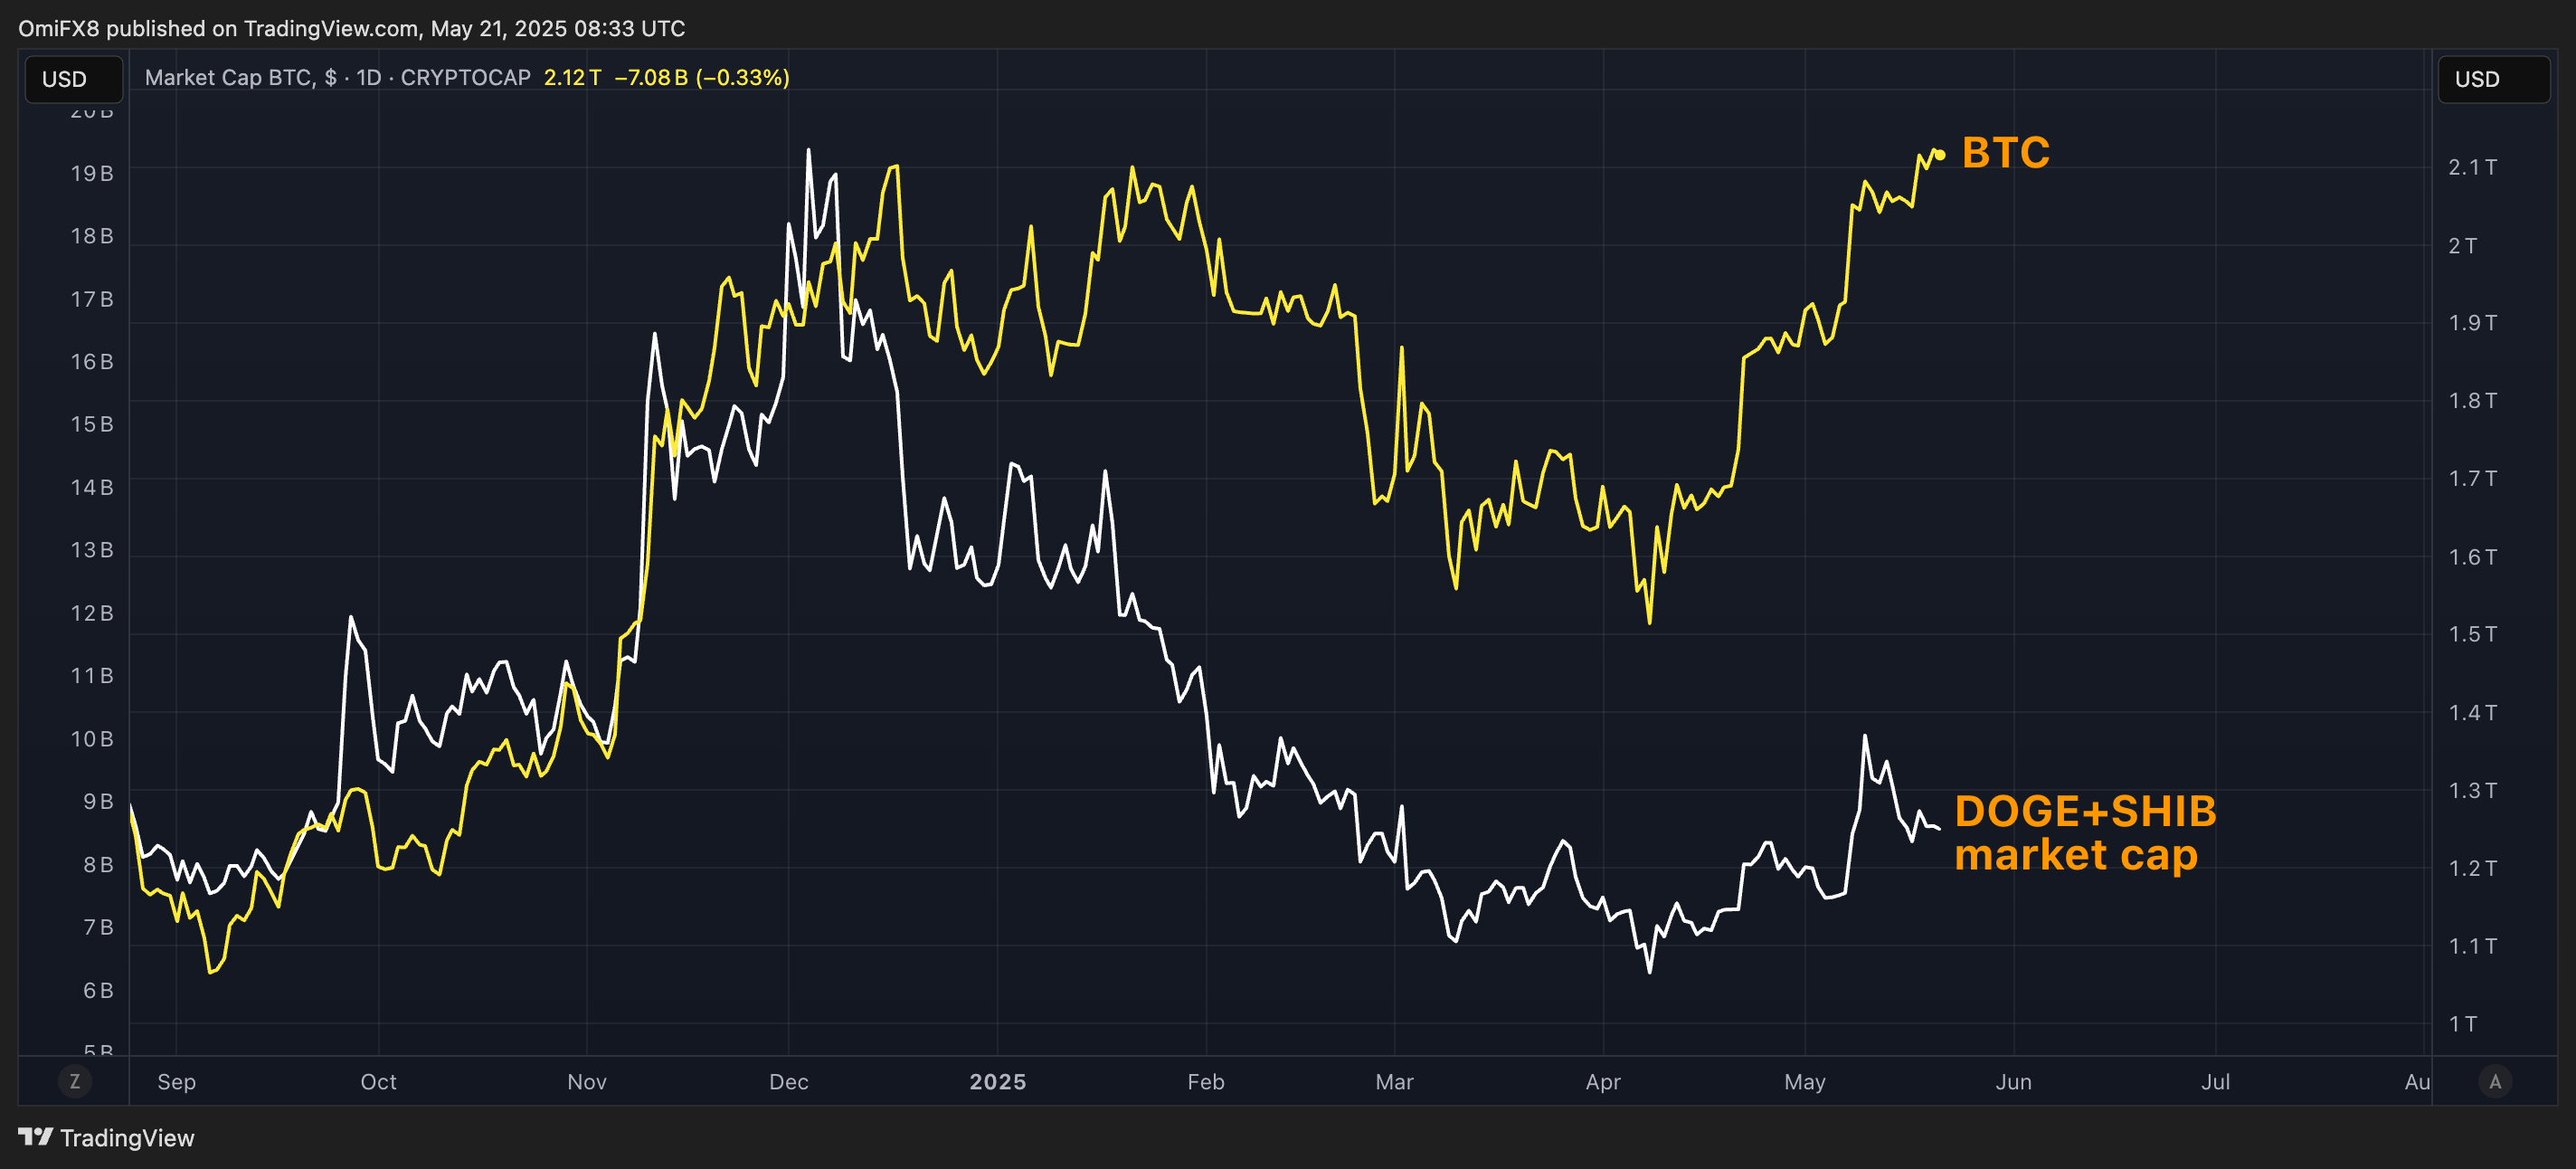
No signs of speculative fervorHistorically, interim and major bitcoin tops, including the December-January one, have been characterized by speculative fervour in the broader market, leading to a sharp rise in market valuations for non-serious tokens such as Doge and SHIB.
There are no such signs now, with the combined market cap of DOGE and SHIB well below their January highs.
The bitcoin perpetual futures market shows demand for bullish Leveraged bets, understandably so, considering BTC is trading near record highs.
However, the overall positioning remains light, with no signs of excess leverage build-up or bullish overheating, as evidenced by funding rates hovering well below highs seen in December.
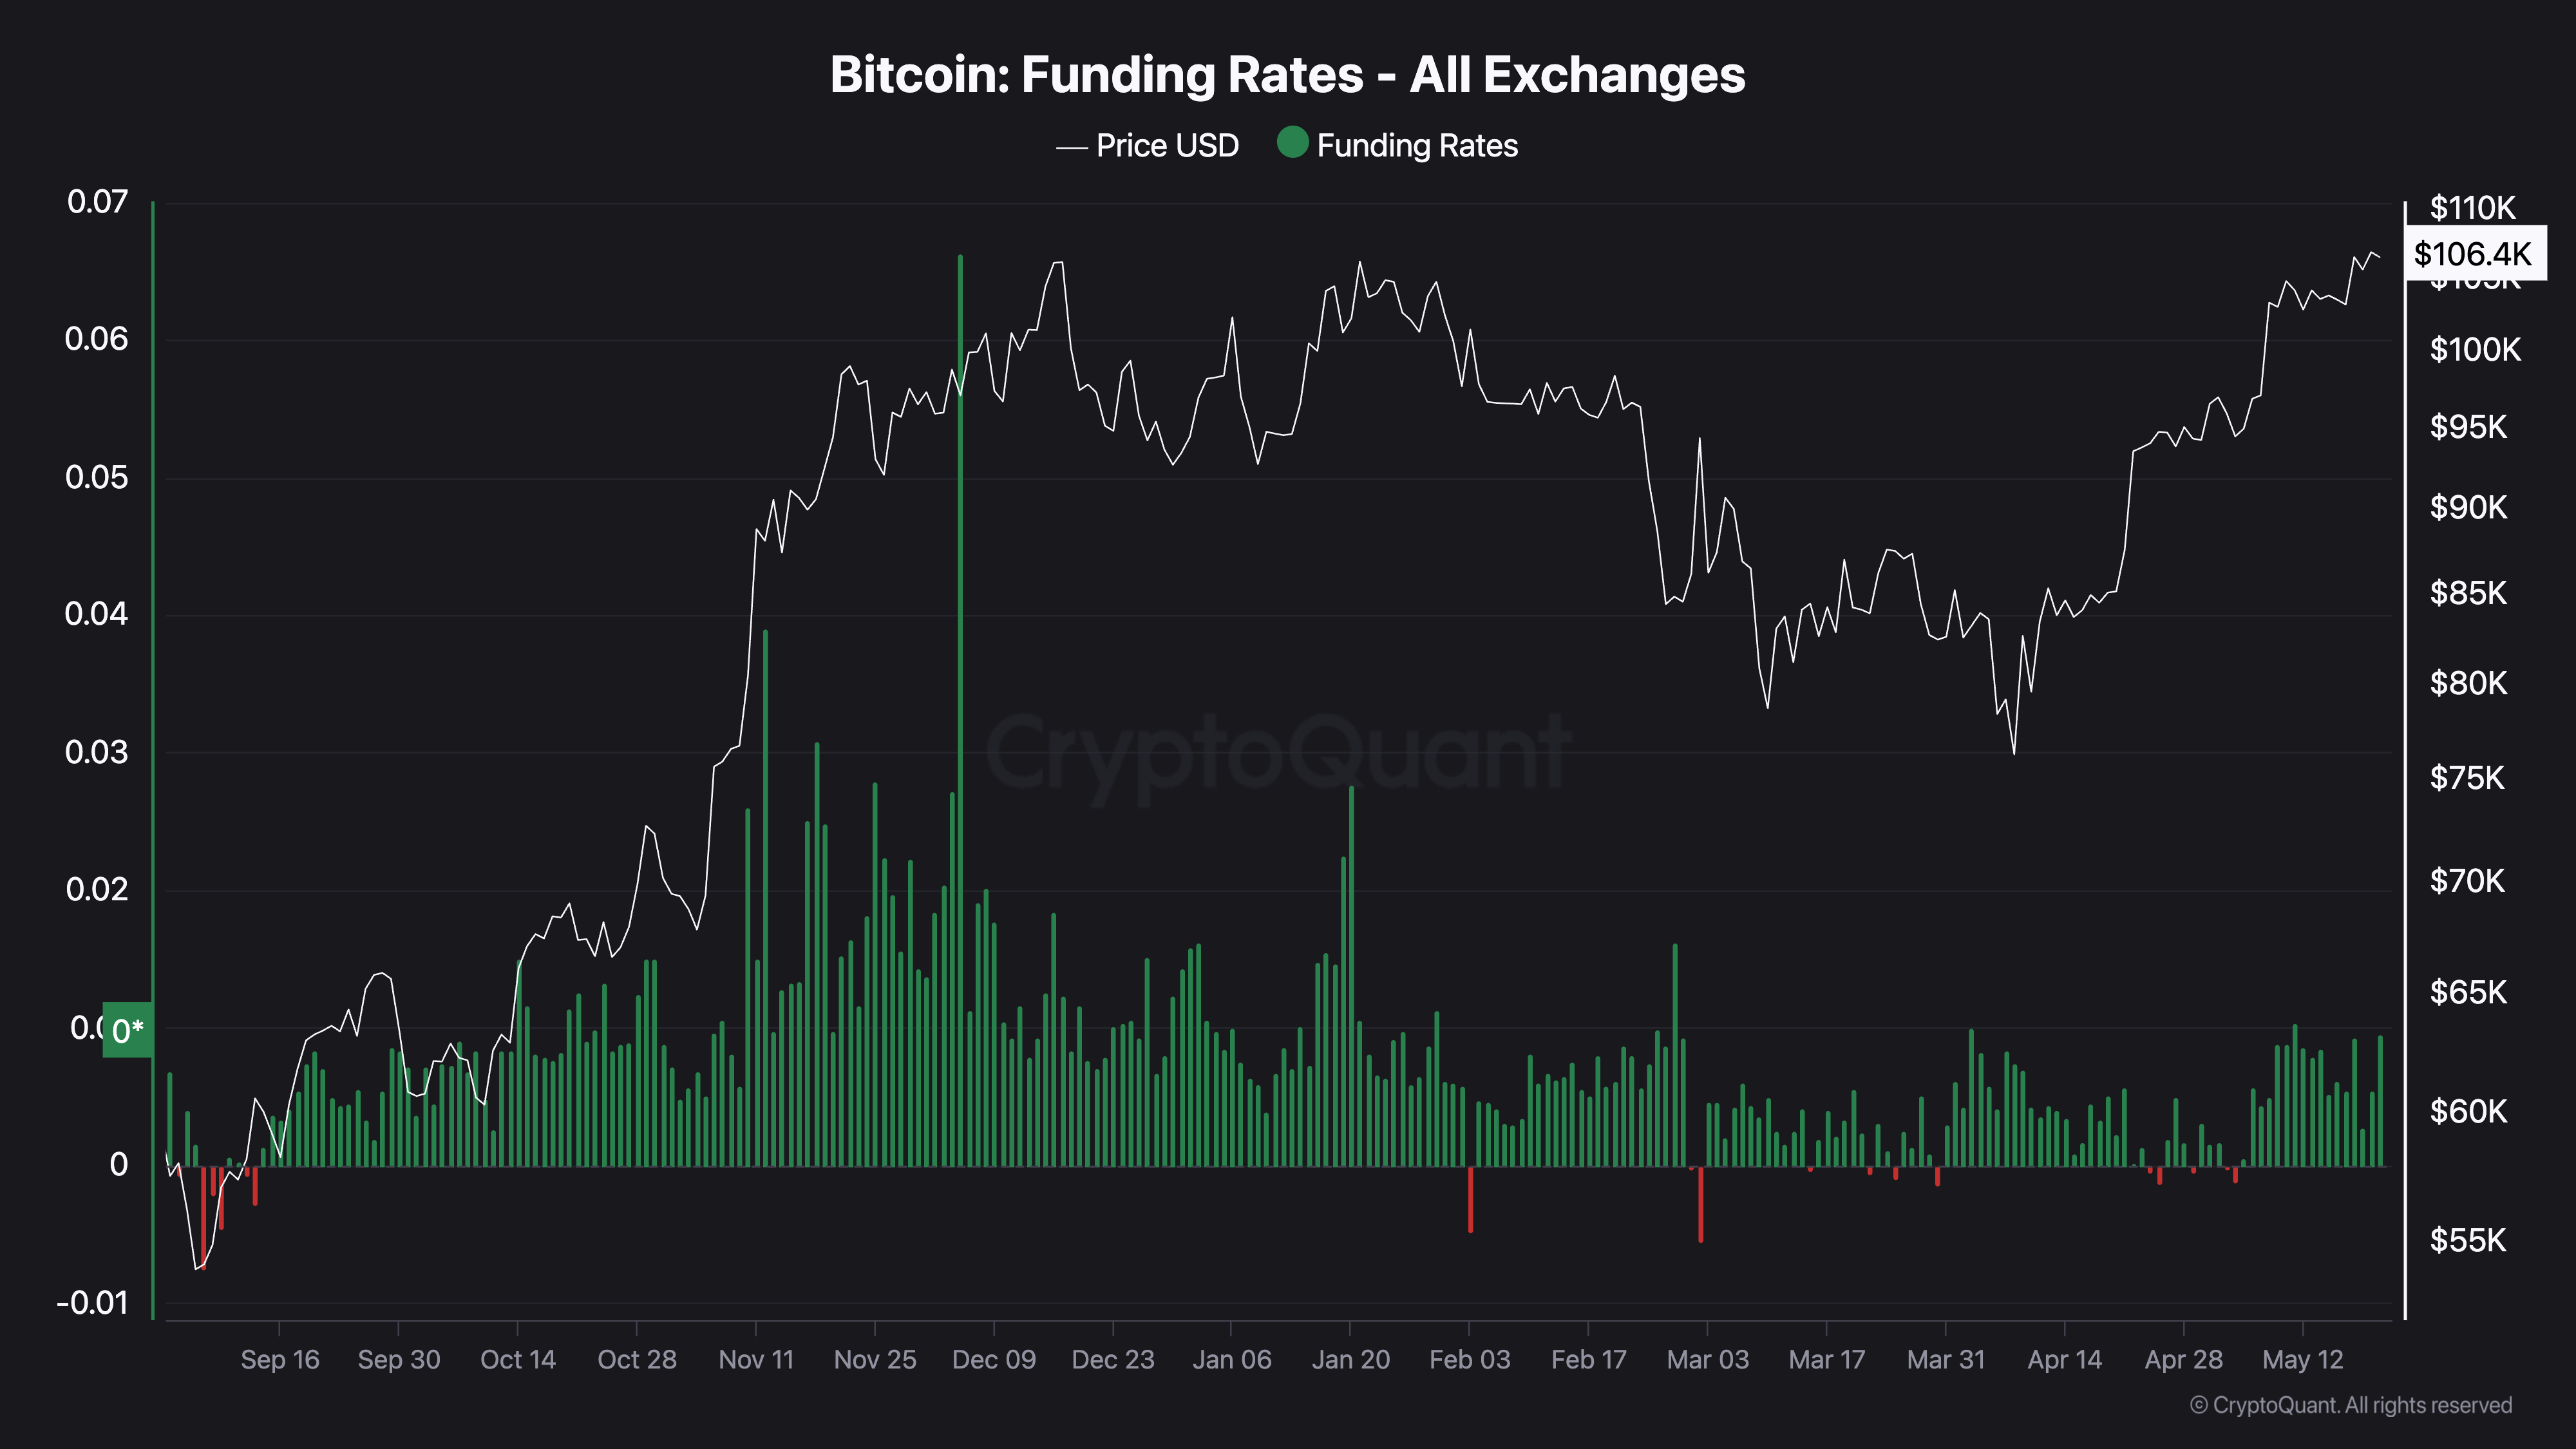
The chart shows funding rates, which refer to the cost of holding perpetual futures bets. The positive figure indicates a bias for longs and willingness among the bulls to pay shorts to keep their positions open. It’s a sign of bullish market sentiment.
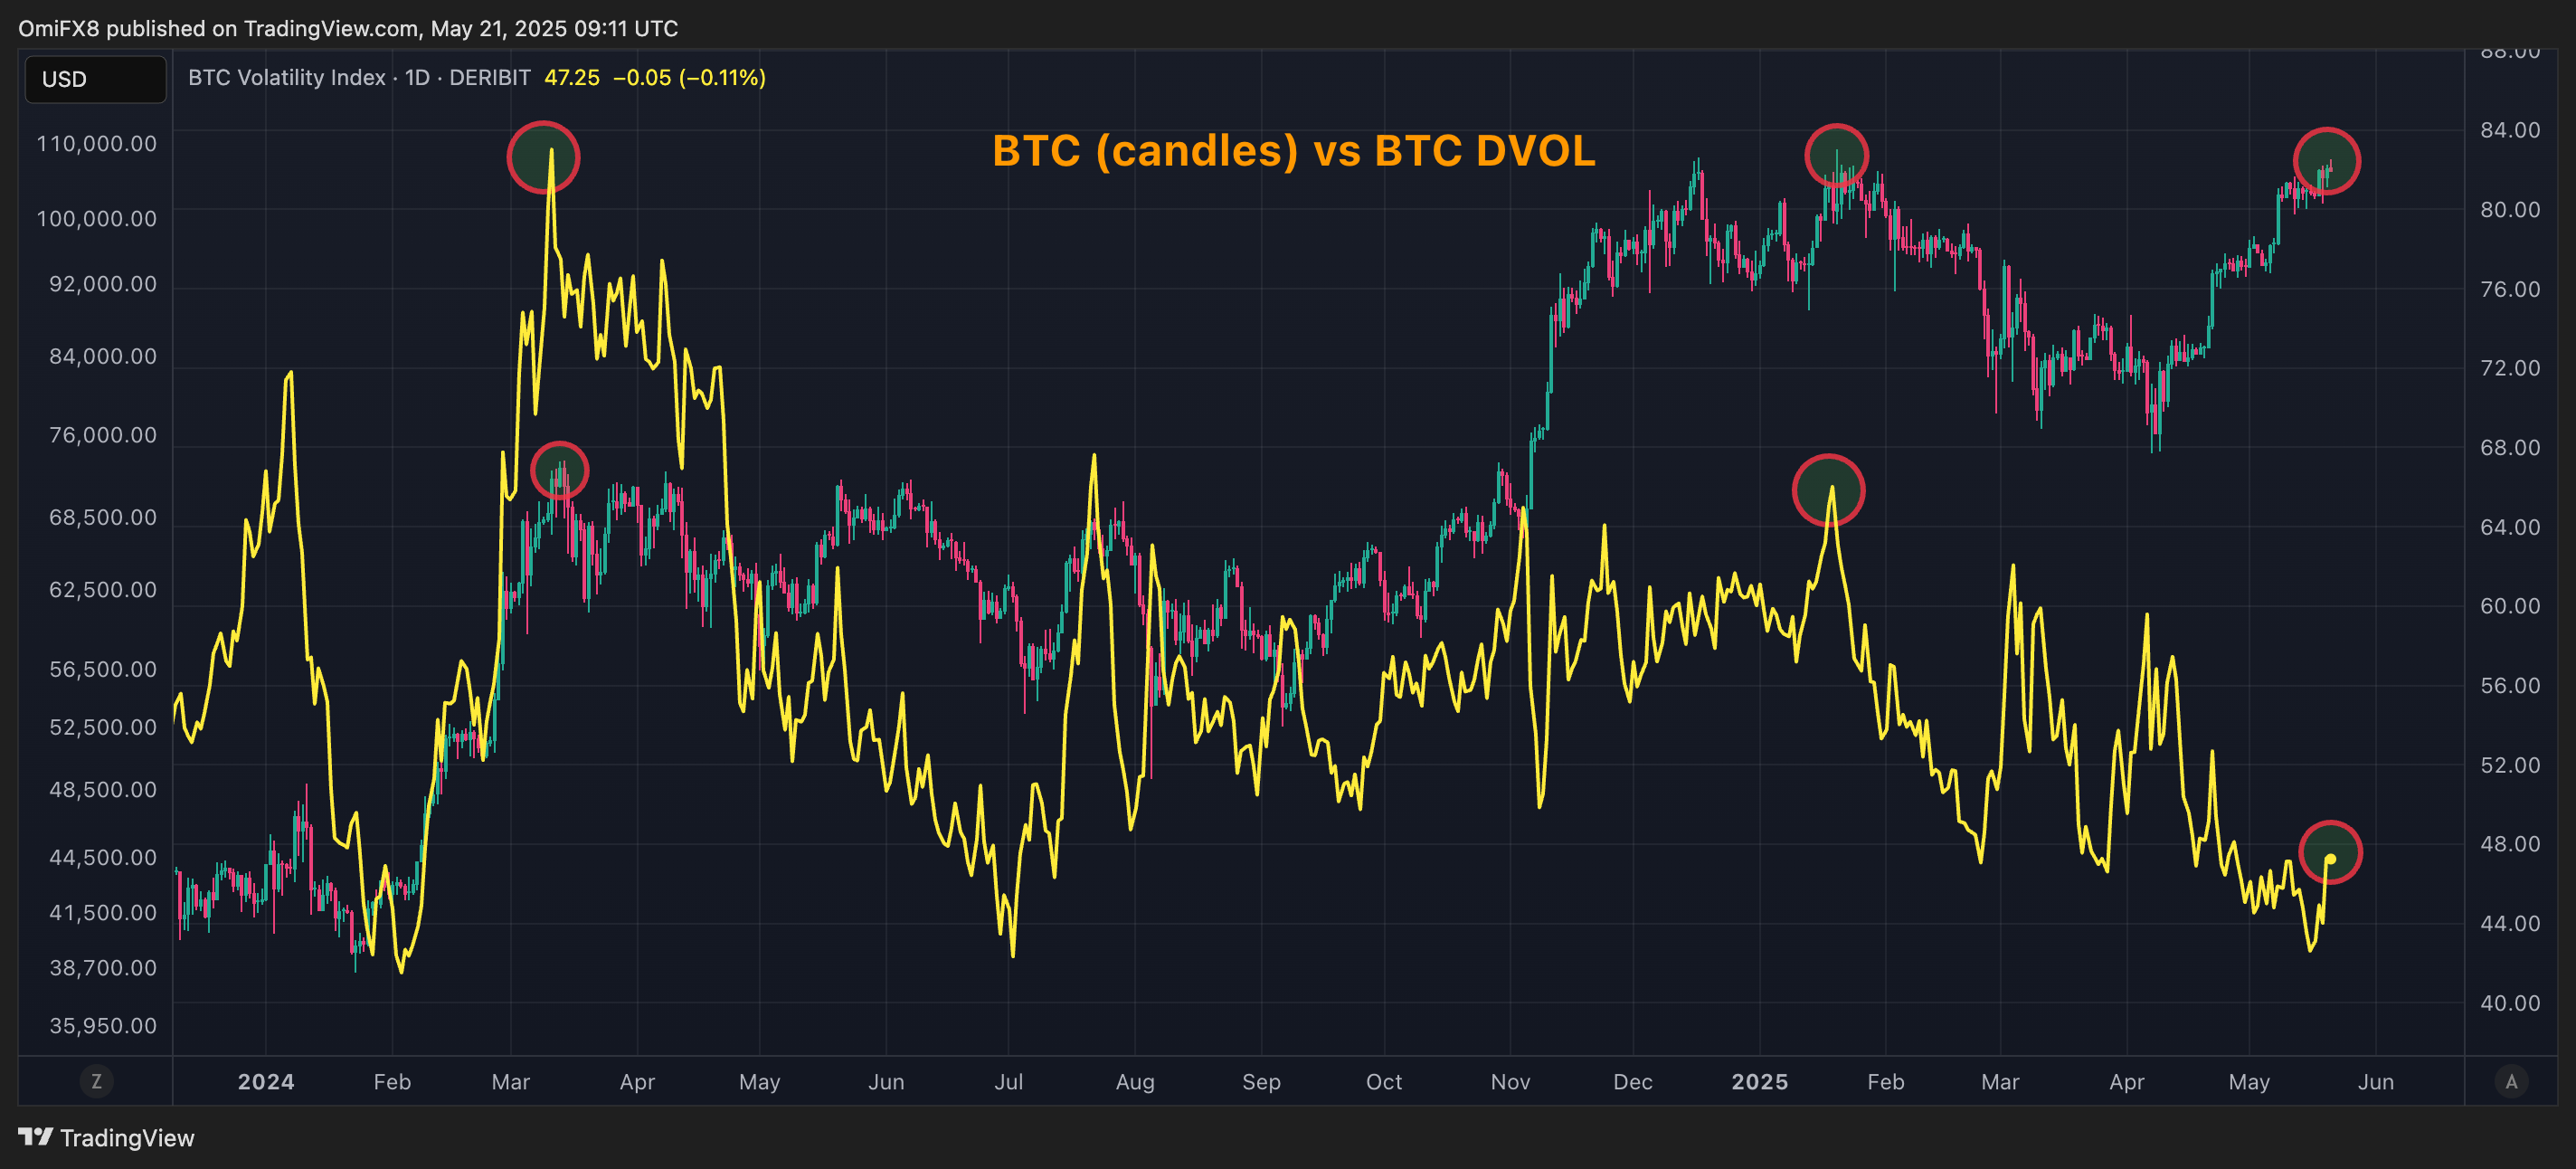
Implied volatility suggests calmThe bitcoin market appears much calmer this time, with Deribit’s DVOL index, measuring the 30-day expected or implied volatility, significantly lower than levels observed in December-January and March 2024 price tops.
The low IV suggests traders are not pricing in the extreme price swings or uncertainty that typically exists in an overheated market, indicating a more measured and potentially more sustainable uptrend.