Bitcoin’s ’Proven Momentum Indicator’ Triggers Bull Signal—$140K-$200K Price Targets Now in Play

Another cycle, another green light. Bitcoin’s so-called ’proven momentum indicator’—the one that nailed previous bull runs—just flashed its buy signal. Cue the institutional PowerPoint decks.
Why this time is (maybe) different
The metric, which tracks price acceleration against historical breakouts, suggests we’re entering the ’hyperbolic’ phase. Last time this happened? BTC rallied 300% in 5 months. Traders are already front-running the usual suspects—ETF inflows, halving scarcity, and that one hedge fund manager who’ll inevitably call it ’gold 2.0’ again.
The cynical footnote
Of course, Wall Street will take credit when it hits $200K—after spending years calling it a ’fraud.’ Classic.
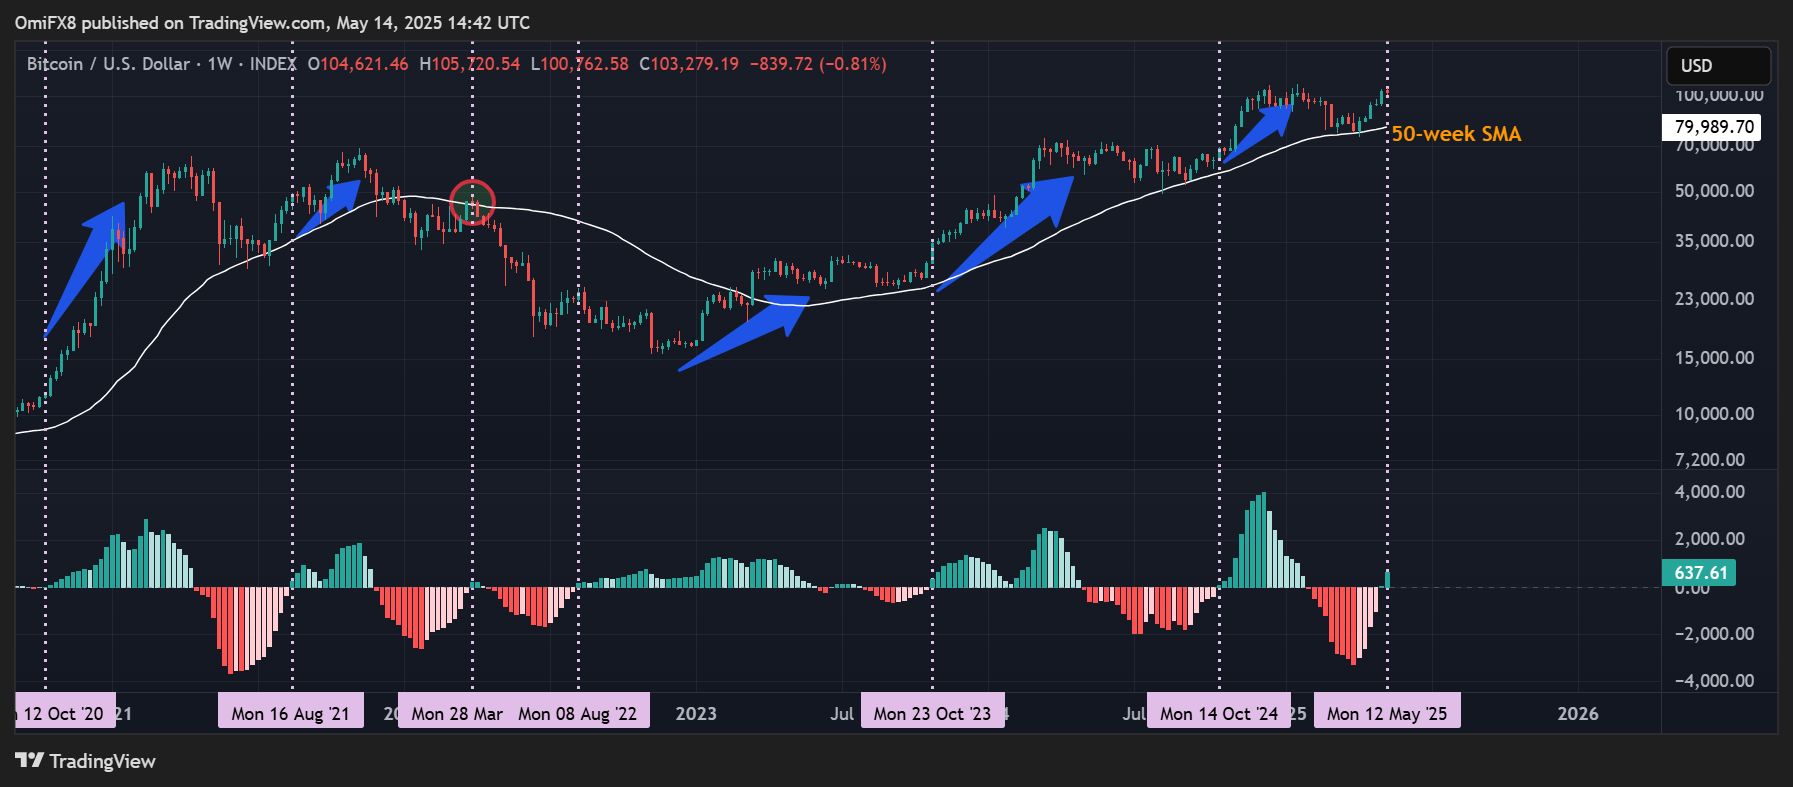
BTC’s weekly chart MACD has crossed above zero, indicating a renewed bullish momentum.
The latest bullish signal follows bitcoin’s bounce from the 50-week simple moving average (SMA), replicating patterns observed in mid-2024 and early 2023. On both occasions, BTC subsequently experienced strong rallies.
Note how the MACD flipped positive in the second half of October, warning of a big MOVE higher. BTC broke above $70K in early November and eventually reached record highs in December.
Over the past five years, the MACD has crossed into positive territory five times, with only one false signal in March 2022, which trapped bulls (marked by circle) on the wrong side of the market.
The latest signal is consistent with the bullish macro picture and analysts’ calls for a rally to higher levels. Early this week, Standard Chartered said that institutional adoption and investment lows could lift bitcoin as high as $200K.
In a report shared with CoinDesk on Tuesday, analysts at Bitfinex said BTC is evolving into a global macro reserve asset and could rise to $150K-$180K in 2025-26.
