Ether and Bitcoin Cash Break Free From Downtrends as Meme Coins DOGE, SHIB Show Signs of Life

Crypto markets roar back as ETH and BCH/BTC smash through resistance—just as Wall Street ’experts’ finish drafting their bearish quarterly reports.
Ether leads the charge with a decisive breakout, while Bitcoin Cash’s ratio to BTC stages a surprise reversal. Meanwhile, DOGE and SHIB—the internet’s favorite joke tokens—defy gravity with unexpected support levels holding firm.
Are we seeing the start of a proper altseason, or just another head fake before the suits short it into oblivion? The charts don’t lie—but your fund manager might.
Ether breakout
Ether’s price has surged more than 8% today, piercing the trendline (see the left-hand chart) that represents the downtrend from December highs above $4,100. In other words, demand has finally managed to overpower the supply zone defined by the trendline, confirming a bullish shift in the market trend.
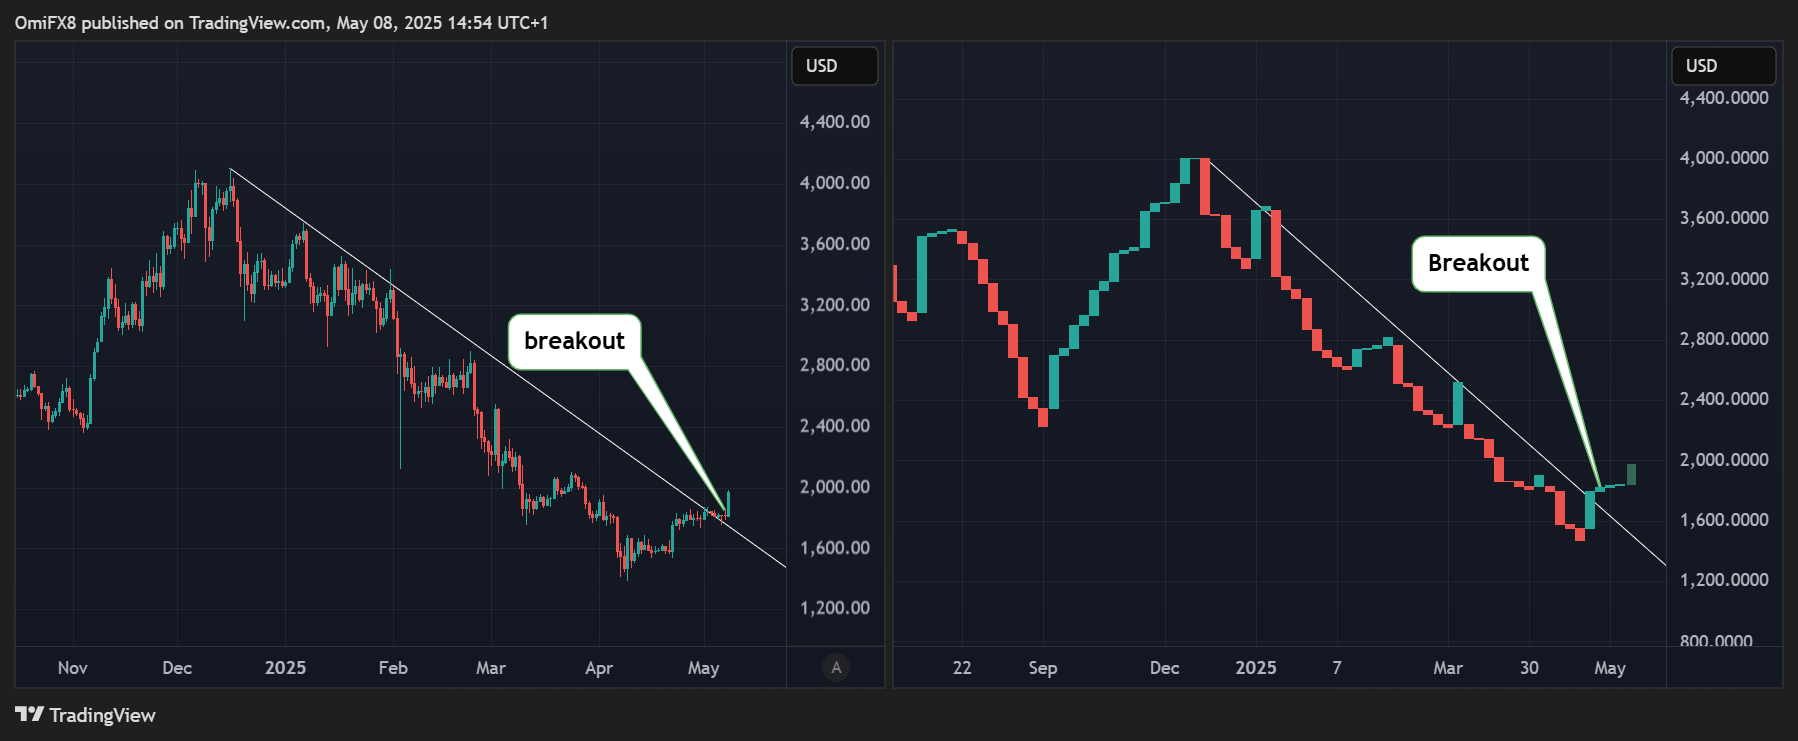
The three-line break chart (on the right) shows a similar breakout. The line break chart
focuses on price movements and changes in trend while ignoring time, helping traders filter out erratic price movements and noise. As a result, signals on the line break chart are considered more reliable and durable signals.
The breakout shifts focus to resistance between $2,300 and $2,400, the support zone from October and November.
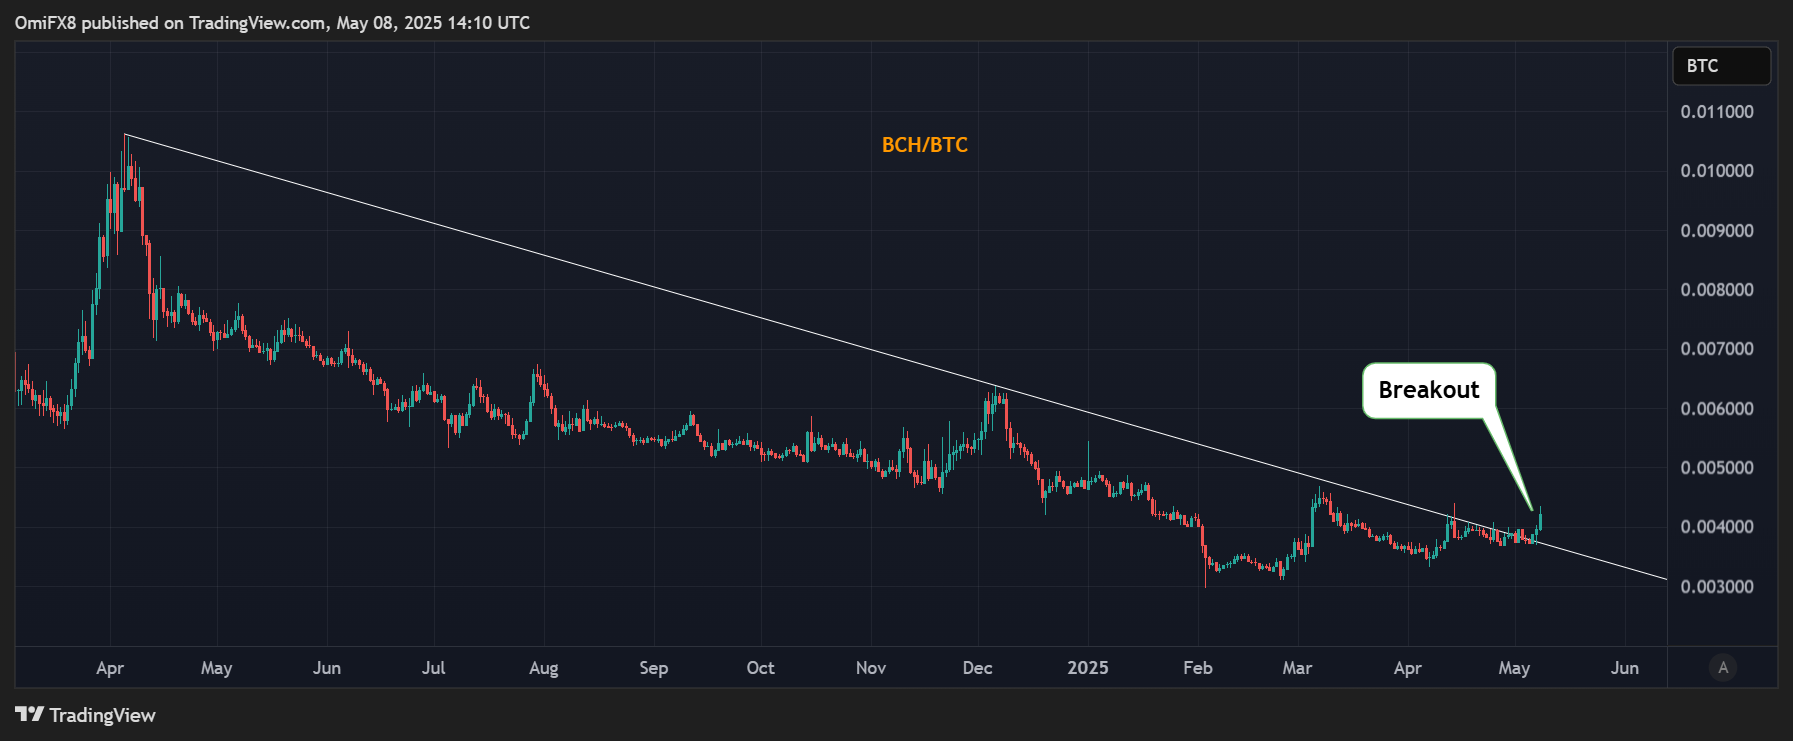
BCH/BTC
The ratio between U.S. dollar prices for Bitcoin cash and bitcoin has risen 11% this week, topping a trendline characterizing the brutal year-long bear market.
The bullish development suggests BCH outperformance relative to bitcoin in the coming days.
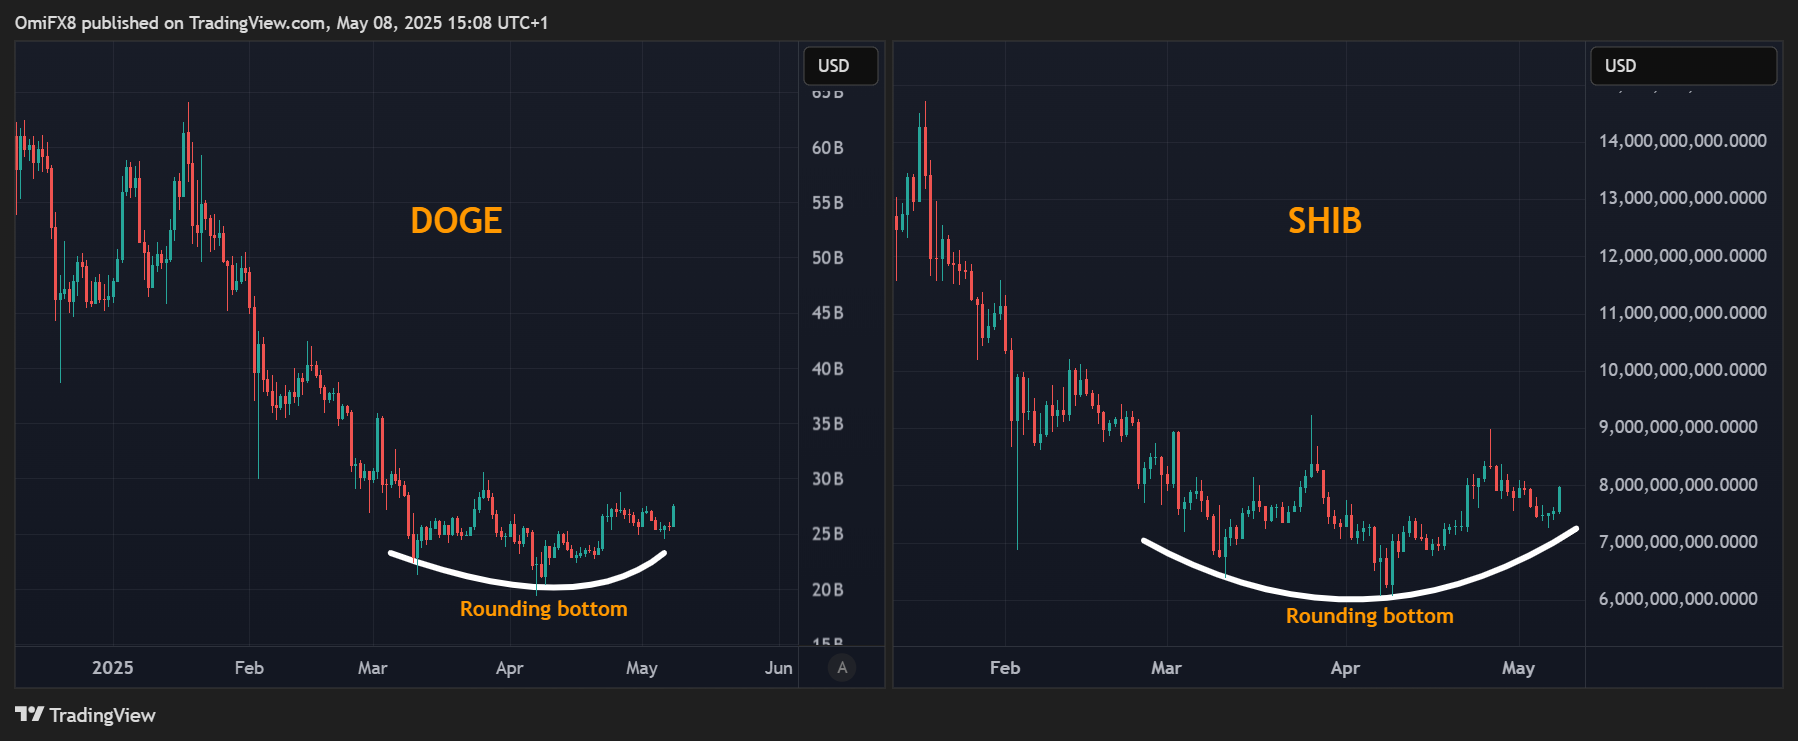
DOGE, SHIB bottoms
The market caps for DOGE and SHIB were up 7% and 5% at the time of writing, with their respective daily charts showcasing a "rounding bottom" pattern.
A rounding bottom happens after a significant downtrend, as in DOGE and SHIB’s cases. and signals a shift to a bullish market. It shows a change from lower highs to higher lows, indicating that buying interest is starting to increase.