Ethereum Faces Looming Correction: Key Indicators Spark Concerns

Ethereum's rally hits a wall—technical signals flash red across the board.
The Overheated Engine
Momentum indicators scream overbought. The RSI hasn't seen these levels since the last major pullback. Trading volume? Diverging from price action in a classic bearish signal. It's the kind of setup that makes seasoned traders reach for the sell button, not the 'buy the dip' mantra.
Support Levels Under Siege
Critical support zones are now in play. A breach below the immediate floor could trigger a cascade of automated selling. The order book looks thin on the buy-side at these heights—too many bulls chasing too few bids. It’s a liquidity trap waiting to snap shut.
Macro Whispers in a Crypto World
Don't ignore the broader market jitters. When traditional finance catches a cold, crypto still gets pneumonia. Risk assets are wobbling, and ETH isn't immune. The 'digital oil' narrative falters when refinery demand—aka real-world usage—gets questioned during volatility. Another round of 'institutional adoption' stories won't pay the margin call.
The smart money is watching for a healthy correction, not a catastrophe. A pullback here could lay the groundwork for the next leg up—if the fundamentals hold. But for now, the charts suggest a timeout from the relentless grind higher. After all, what's a crypto cycle without a few 20% haircuts to separate the diamond hands from the leveraged degenerates?

Summarize the content using AI
![]()
ChatGPT

Grok
Ethereum (ETH) $3,139 experienced a rapid recovery, rising over 20% after hitting a low of $2,620 at the beginning of November, and surpassed $3,000 by December 9. However, technical and on-chain indicators raise serious doubts about the sustainability of this rise. Experts highlight critical patterns suggesting an increased likelihood of a sharp correction for ethereum in the coming months.
Tops and Patterns: Cup-and-Handle Phenomenon
Recently, Ethereum’s chart has shown the formation of an inverted cup-and-handle, a classic bearish structure. This pattern often concludes with a sharp break and significant price declines. The rounded top forming after ETH climbed to $4,100 in August, followed by falling below the 50-day and 200-day exponential moving averages, supports this structure.
The “handle” part of the pattern is visible as a rising channel. However, the price consistently failing to overcome the $3,150 resistance indicates waning buyer strength. Analysts suggest that should the price fall below $2,900, at the lower band of the channel, the decline WOULD be confirmed, putting the target region of $1,500 back in focus.
Expected at the start of 2024, this target aligns with a strong support area. Thus, technically, the $1,500 level is not just a possibility but a strong scenario. Bulls need to reclaim the $3,300–$3,450 range to alleviate downward risks; otherwise, the risk remains tilted to the downside.
Massive Ethereum Inflows Put Pressure on Prices
The chart’s weaknesses are not limited to these. On-chain data also reveals developments strengthening sellers’ positions in the short term. The net inflow of 162,000 ETH into Binance on December 5 marked the largest movement since May 2023. CryptoOnChain analysts emphasize that these inflows signal large investors preparing to sell.

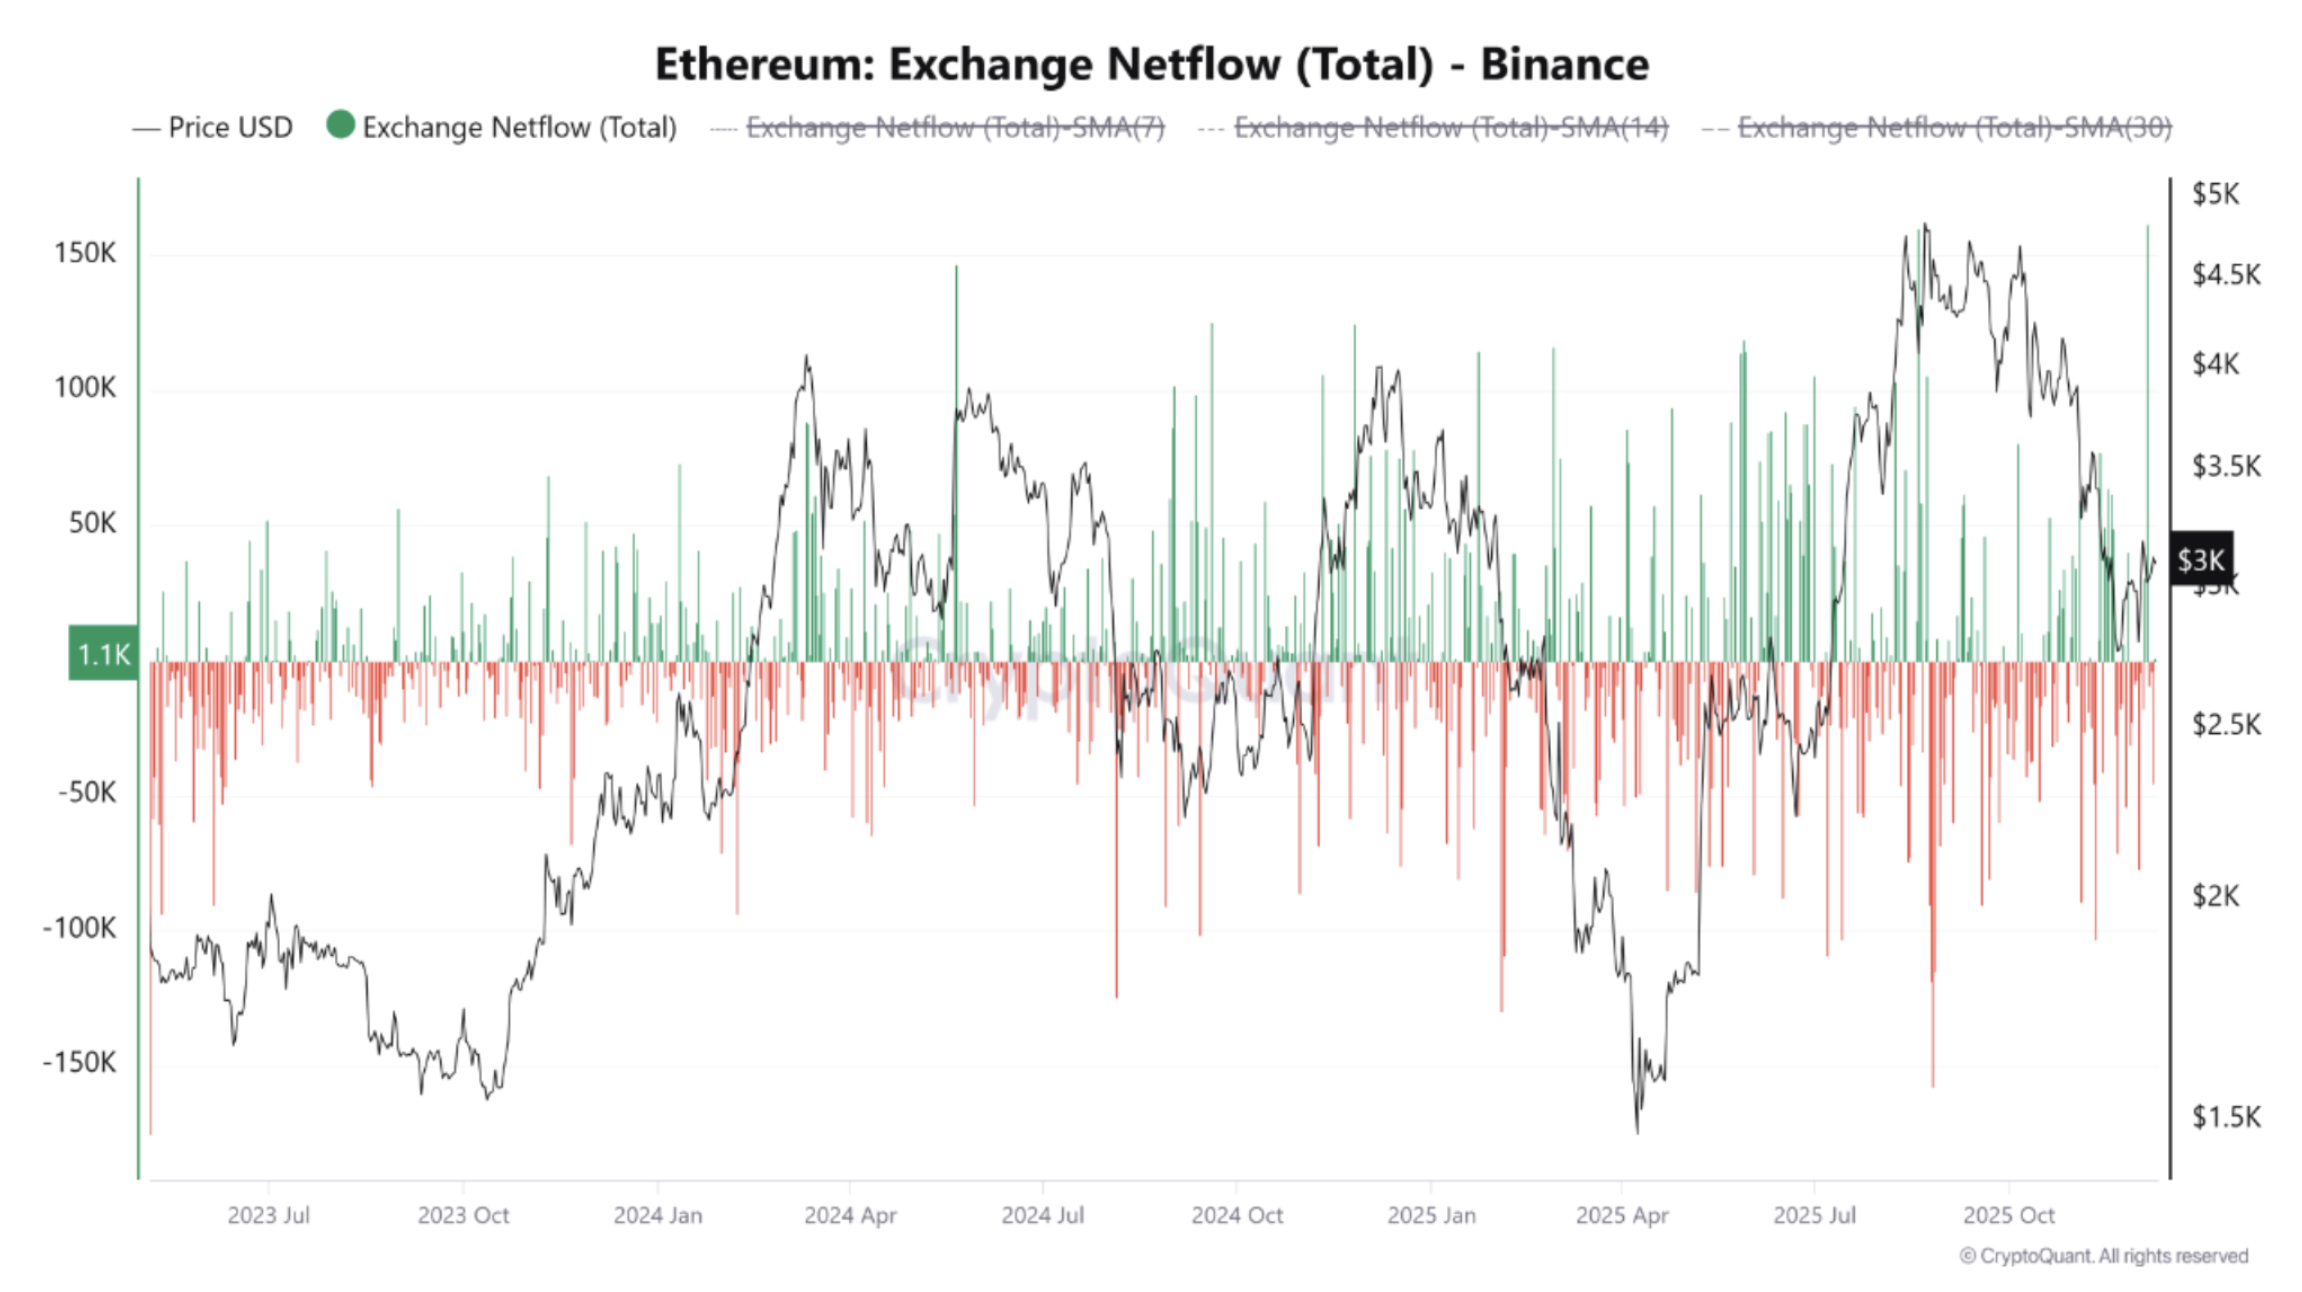
In the past, similar large-scale exchange inflows have typically resulted in periods of high volatility or severe price declines. Furthermore, ETH is currently trading below major moving averages, indicating its vulnerability to sharp losses if selling commences.
Another development in the crypto market adding complexity is the new meme coin trend and increased network activity in the Solana![]() $133 ecosystem. This shift in investor interest from Ethereum to alternative platforms also indirectly pressures Ethereum.
$133 ecosystem. This shift in investor interest from Ethereum to alternative platforms also indirectly pressures Ethereum.
In conclusion, despite attempts at a rally, both technical and on-chain data point to a bearish outlook for Ethereum. Bulls must achieve strong volume closures above $3,300 to regain control. Otherwise, a potential drop below $2,900 could trigger panic selling, leading to a sharp dive towards $1,500.
You can follow our news on Telegram, Facebook, Twitter & Coinmarketcap Disclaimer: The information contained in this article does not constitute investment advice. Investors should be aware that cryptocurrencies carry high volatility and therefore risk, and should conduct their own research.