BTC Price Prediction 2025: Can Bitcoin Reach $200,000 Despite Critical Support Test?

- Is Bitcoin's Bull Run Still Intact?
- Institutional Accumulation vs. Technical Weakness
- 7 Key Indicators Crypto Traders Are Watching
- Global Bitcoin Developments Shaping the Market
- Technical Analysis: The Road to $200,000
- Frequently Asked Questions
As Bitcoin hovers around $108,876 on September 1, 2025, the crypto market faces a pivotal moment. The $107,800 support level has become the battleground between bulls eyeing $200,000 and bears warning of potential downside. This analysis examines the technical indicators, institutional movements, and market dynamics that could determine BTC's path forward, featuring insights from the BTCC research team and on-chain data from CoinMarketCap and TradingView.
Is Bitcoin's Bull Run Still Intact?
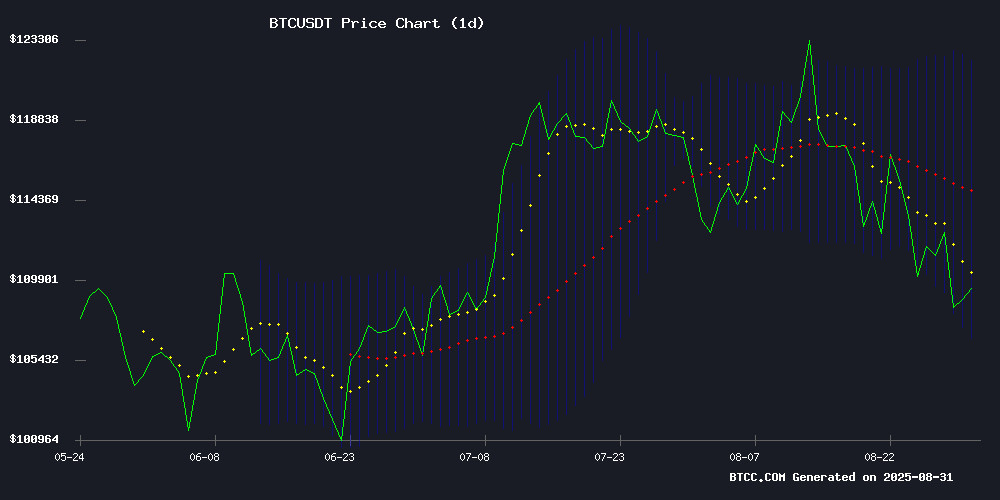
BTC currently trades below its 20-day moving average ($114,368.80) but maintains bullish MACD readings (4,352.79 vs signal line at 2,776.09). The Bollinger Bands suggest potential oversold conditions with price NEAR the lower band at $106,519.42. "The $107,800 support is crucial - a breakdown could trigger moves toward $100,000," notes a BTCC analyst.
Source: BTCC
Institutional Accumulation vs. Technical Weakness
The market presents a fascinating dichotomy. While MicroStrategy continues aggressive BTC purchases (now holding 632,457 BTC worth $68.6B) and Metaplanet seeks $3.8B for bitcoin accumulation, technical indicators flash warning signs. Bitcoin recently closed below the Short-Term Holder Realized Price ($108,928) for only the second time in 2025 - a level that historically signals bearish pressure when breached.
7 Key Indicators Crypto Traders Are Watching
Seasoned traders monitor these metrics to navigate volatility:
| Indicator | Significance | Current Status |
|---|---|---|
| Whale Movements | Large holders often lead market turns | Mixed signals |
| Stablecoin Flows | Dry powder waiting to enter markets | Moderate inflows |
| Funding Rates | Sentiment gauge in derivatives markets | Slightly negative |
| STH Realized Price | Average cost basis of recent buyers | $108,928 (below current price) |
| Exchange Reserves | Potential selling pressure indicator | Declining |
| MVRV Ratio | Profit-taking likelihood | Neutral zone |
| Hash Ribbons | Miner capitulation signals | No distress |
Global Bitcoin Developments Shaping the Market
From El Salvador redistributing its 6,285 BTC holdings to mitigate quantum computing risks to Hong Kong University exploring BTC tuition payments, institutional adoption continues evolving. Meanwhile, Amsterdam's Amdax raised $23M to launch a Bitcoin treasury company targeting 1% of BTC's total supply (210,000 BTC).
Technical Analysis: The Road to $200,000
Reaching $200,000 requires overcoming several hurdles:
- Immediate: Reclaim $114,368 (20-day MA)
- Intermediate: Break $124,427 ATH
- Psychological: Sustain above $150,000
The BTCC research team notes: "While the long-term trajectory remains intact, investors should monitor $107,800 closely. A breakdown could delay the $200,000 timeline significantly."
Frequently Asked Questions
What is Bitcoin's current support level?
Bitcoin is testing critical support at $107,800 as of September 1, 2025, with the price currently at $108,876.
Can Bitcoin really reach $200,000?
While technically possible (requiring +83% from current levels), BTC must first reclaim key resistance levels and maintain above critical support. Institutional accumulation suggests long-term bullish potential.
What are the biggest risks to Bitcoin's price?
Key risks include breakdown below $107,800 support, macroeconomic headwinds, and potential regulatory developments. However, institutional adoption appears to be accelerating.
How are institutions affecting Bitcoin's price?
Companies like MicroStrategy (holding 632,457 BTC) and new entrants like Amdax are creating significant demand pressure, potentially offsetting retail selling during corrections.
What makes $107,800 such an important level?
This represents the blended average cost basis of short-term holders (1 week to 6 months). Historically, sustained breaks below this level have led to extended corrections.
