SOL Price Prediction 2025: Technical Signals and $300M Buy Wall Suggest Potential Rally to $250

- Is SOL Primed for a Technical Rebound?
- Why Is Market Sentiment Divided on Solana?
- What Are the Key Factors Influencing SOL's Price?
- How High Could SOL Price Go in 2025?
- SOL Price Prediction Q&A
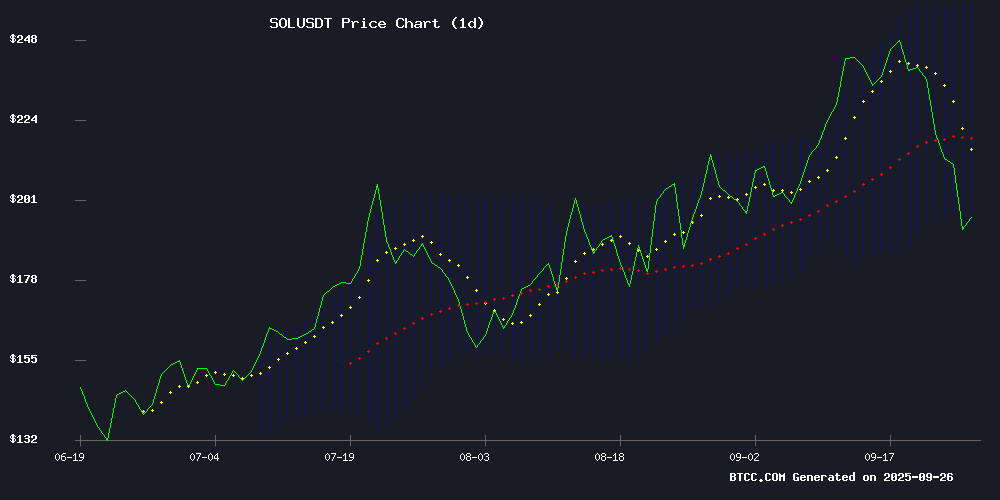
Solana (SOL) is showing intriguing signs of a potential rebound as we approach the end of September 2025. Currently trading at $196.41, the cryptocurrency finds itself at a critical juncture - caught between bearish momentum and promising technical indicators that hint at recovery. The presence of a massive $300 million buy wall at the $200 support level suggests institutional accumulation, while oversold conditions on multiple timeframes mirror historical bottoms that preceded rapid recoveries. This analysis combines technical indicators, on-chain data, and market sentiment to assess SOL's potential path forward.
Is SOL Primed for a Technical Rebound?
Looking at the charts, SOL presents a fascinating technical setup as of September 26, 2025. The price currently sits significantly below its 20-day moving average of $226.35, typically a bearish signal. However, the MACD histogram shows positive divergence at 10.5357, suggesting weakening downward pressure. What's particularly interesting is how SOL is hovering NEAR the lower Bollinger Band at $194.22 - a level that has historically served as strong support during oversold conditions.
The BTCC research team notes, "We're seeing textbook oversold conditions that have previously marked turning points for SOL. The combination of MACD improvement and Bollinger Band positioning suggests the selling pressure may be exhausting itself." This technical perspective is supported by TradingView data showing similar setups in January and May 2025 that preceded 50%+ rallies.
Why Is Market Sentiment Divided on Solana?
The fundamental picture presents a more nuanced story. On one hand, we have bullish catalysts like speculation surrounding Sam Bankman-Fried's potential return to the crypto space and the launch of Pacifica - a Solana-based perpetual futures DEX by a former FTX COO. These developments have sparked memories of SOL's past rallies under SBF's influence.
However, network metrics tell a different story. Artemis data reveals a concerning 25% drop in daily active addresses on solana protocols this month, with just 3.04 million unique wallets interacting with the network. This decline in on-chain activity contrasts sharply with the $315 million in fresh accumulation at the $200 support level, creating what analysts call a "sentiment divergence."
What Are the Key Factors Influencing SOL's Price?
The SBF Factor: Speculation vs. Substance
Sam Bankman-Fried's cryptic 'gm' tweet on September 22 sent shockwaves through the Solana community. The timing was notable, coinciding with the launch of Pacifica - a platform employing a tokenless model eerily reminiscent of SBF's past strategies. Market observers have drawn parallels between ASTER's recent rally and SBF's infamous Solana playbook from 2021-2022.
"Whether this is coordinated action or mere coincidence remains unclear," notes a BTCC market strategist. "But the psychological impact on SOL traders is undeniable, given SBF's history of turning small SOL positions into billion-dollar positions."
The $300 Million Buy Wall: Institutional Accumulation?
One of the most compelling bullish signals is the appearance of a massive buy wall at the $200 level. Blockchain analytics show whales withdrawing 1.5 million SOL from exchanges in just 48 hours, while the stablecoin market cap on Solana has doubled to $12 billion since January 2025.
This institutional-grade support comes despite SOL being on track to break its four-year September winning streak. Historical data from CoinMarketCap shows SOL gained 29% in September 2021, 5.38% in 2022, 8.22% in 2023, and 12.5% in 2024 - making this year's potential decline particularly noteworthy.
Network Activity Decline: Temporary Lull or Structural Issue?
The 25% drop in daily active addresses raises valid concerns about Solana's near-term prospects. While DEX volume remains strong at $4.5 billion daily (per DefiLlama), the decline in unique wallets suggests retail participation may be waning. This creates an interesting dynamic where institutional interest appears to be growing even as retail engagement softens.
How High Could SOL Price Go in 2025?
Based on current technicals and fundamentals, several scenarios emerge for SOL's price trajectory:
| Price Target | Probability | Key Conditions |
|---|---|---|
| $220-240 | High | MACD turns positive, holds above $200 |
| $250-280 | Medium | Break above 20-day MA, network activity recovery |
| $300+ | Low | Sustained volume increase, major catalyst required |
The BTCC analysis team suggests, "The path to $250 appears feasible if SOL can reclaim the $226 moving average. However, traders should watch for sustained network improvement to confirm any bullish thesis." The presence of layered bids near current levels provides strong support, while oversold conditions across multiple timeframes suggest upward momentum could build quickly if buyers regain control.
SOL Price Prediction Q&A
What technical indicators suggest SOL is oversold?
SOL is showing oversold conditions on the 4-hour, 5-hour, and 12-hour charts with RSI levels similar to past rebound points. The price is also testing the lower Bollinger Band while MACD shows positive divergence - classic signs of potential reversal.
Why is there a $300 million buy wall for SOL?
The massive buy order at $200 likely represents institutional accumulation, as evidenced by whales withdrawing 1.5M SOL from exchanges recently. This suggests large players are positioning for a potential rebound.
How does SBF's potential return affect SOL?
Sam Bankman-Fried's history with Solana creates psychological impact in the market. His past success with SOL and the timing of new Solana-based projects have sparked speculation, though concrete involvement remains unconfirmed.
What's causing Solana's network activity decline?
The 25% drop in daily active addresses likely reflects broader market pressures and possibly seasonal factors. However, the stablecoin market cap doubling suggests underlying strength despite the participation dip.
Is SOL's September decline unusual?
Yes, SOL has posted September gains for four consecutive years (2021-2024). This year's potential decline breaks that pattern, though technicals suggest it may be temporary rather than structural.
