BNB Defends $1,046 as Wave-3 Rally Shows Signs of Fatigue

BNB bulls dig in at critical support level while technical indicators flash warning signs.
Technical Standoff
Binance Coin battles to maintain its $1,046 foothold as the third-wave rally loses momentum. The digital asset's resilience at this price point signals either consolidation before another leg up or exhaustion after weeks of gains.
Market Mechanics
Trading volume patterns suggest institutional players are taking profits while retail traders continue accumulating positions. The $1,046 level now represents a psychological battleground between bulls defending their gains and bears waiting for breakdown confirmation.
Wave Theory in Action
Elliot Wave practitioners note the typical five-wave pattern appears incomplete, leaving room for either extended gains or corrective movements. The current stagnation mirrors historical patterns where assets either breakout spectacularly or retrace significantly.
Regulatory Shadows
Meanwhile, traditional finance institutions continue debating cryptocurrency valuation methodologies—because apparently valuing decentralized networks using centralized finance models makes perfect sense.
Next moves depend entirely on whether $1,046 holds or breaks. The entire altcoin market watches this pivotal moment.

The momentum has carried price action into a critical zone where a local top may be forming. Market watchers are now focused on whether buyers can sustain this rally or if a corrective phase is about to begin.
Wave Structure Points to Cooling Phase Before Next Rally
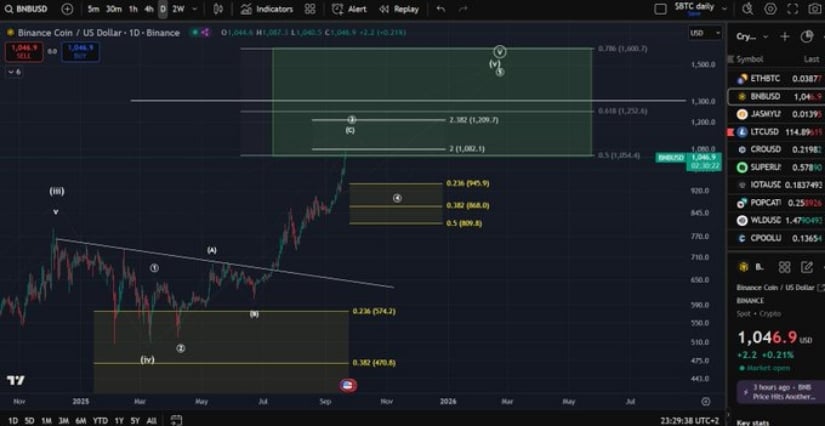
In a recent post, analyst Man of Bitcoin noted that BNB has reached the next upside target in its wave-3 structure, suggesting the possibility of a local top.
The chart shows a sharp rally from mid-year consolidation, with price now approaching the projected resistance zone between $1,050 and $1,200. This level aligns with the Fibonacci extension range, often a point where profit-taking accelerates and corrective pullbacks emerge.
Source: X
Despite the rapid climb, indicators show that momentum may be stretched in the short term. The Elliott Wave count implies that wave-3 could be nearing completion, which typically precedes a corrective wave-4 retracement before another push higher. If the coin pulls back, the $945–$880 region appears as the primary support zone where buyers may step back in.
Looking ahead, the broader structure remains bullish as long as the price holds above key retracement levels. Wave-5 projections could carry the asset well beyond $1,200 if momentum resumes after consolidation. For now, market participants are balancing between Optimism for further gains and caution that the current rally may be due for a cooldown.
Price Consolidates Around $1,031 Amid Market Pullback
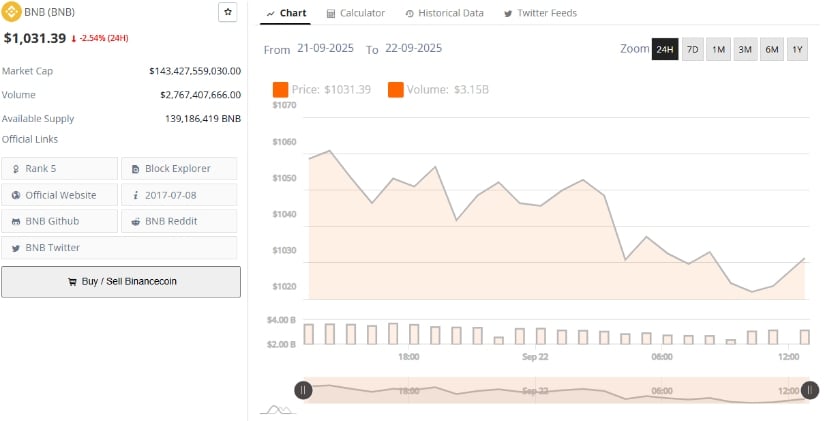
According to recent data, the coin is trading at $1,031.39, reflecting a 2.54% decline in the last 24 hours. The token’s market capitalization currently stands at $143.42 billion, supported by a trading volume of $2.76 billion. Despite the dip, BNB remains the fifth-largest cryptocurrency by market value, demonstrating strong liquidity and consistent activity across exchanges.
Source: BraveNewCoin
The price action suggests that the asset is consolidating after testing higher levels earlier in the week. Market participants are reassessing short-term momentum, with buyers defending the $1,020 zone as a key support. If demand strengthens, the cryptocurrency could attempt to reclaim the $1,050 range, though broader market conditions will remain a decisive factor in its next move.
Trend Strength and Market Sentiment
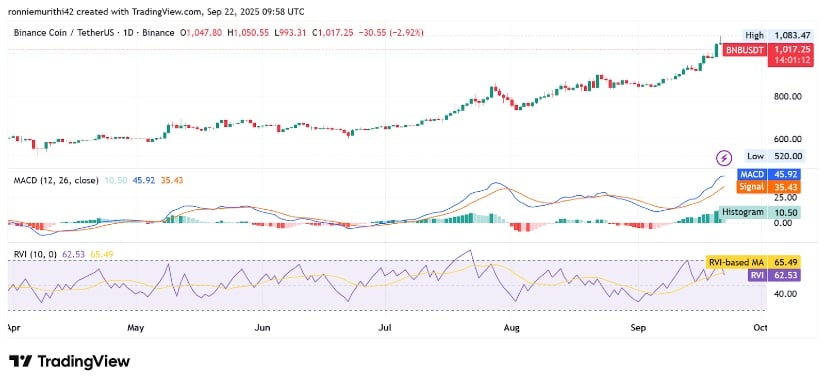
At the time of writing, the coin was trading at $1,014.80, marking a 3.15% daily decline. Despite the pullback, BNB recently set a new high at $1,083.47, showing strong bullish momentum over the past few weeks. The candlestick structure suggests that the current dip may be a short-term correction within an ongoing uptrend.
Source: TradingView
Looking at the indicators, the MACD remains bullish, with the MACD line (45.73) still above the signal line (35.39), though the histogram shows some weakening momentum.
Meanwhile, the Relative Vigor Index (RVI) is at 62.59, slightly below its moving average (65.49), hinting at short-term cooling after the strong rally. If buying pressure resumes, the asset could retest its recent highs, but if the correction deepens, support may be found around the $950–$980 range.
